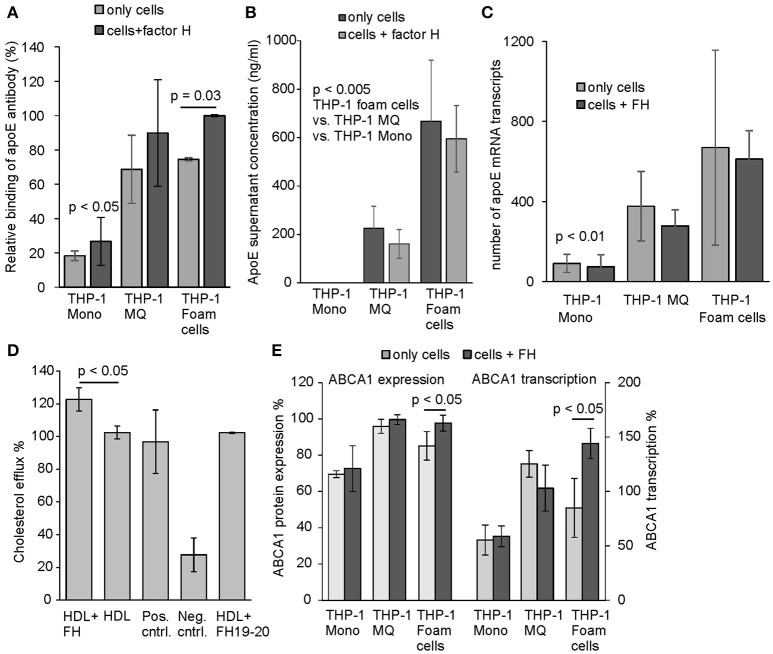
Figure 5.
Binding, secretion, and expression of apoE and cholesterol efflux by THP-1 cells. (A) Surface expression of and/or binding of apoE from culture supernatants to THP-1 monocytes, THP-1 macrophages and cholesterol-loaded THP-1 cells detected by anti-apoE antibody. Cells were incubated with and without FH for 24 h. Next, the cells were washed and detached from the tissue culture plates. Presence of apoE on cell surfaces were detected using anti-human apoE and Alexa 488 labeled goat anti-rabbit antibody in flow cytometry. ApoE binding is shown as relative to the maximum intensity in each individual experiment (n = 3). (B) Secretion of apoE to cell culture media by THP-1 monocytes, THP-1 macrophages and cholesterol-loaded THP-1 cells detected by ELISA (n = 4). (C) Number of apoE mRNA transcripts analyzed by sequencing the cell isolated mRNA (n = 4) (D) Cholesterol efflux from non-loaded THP-1 macrophages labeled with fluorescent cholesterol in the presence or absence of FH (n = 3). Cholesterol efflux in the presence of equal molarity of FH19-20 is shown. The positive (Pos. cntrl. from Abcam) and non HDL treated controls (Neg. cntrl.) were included in the assay. (E) Protein expression and transcription levels of ABCA1 in THP-1 monocytes, THP-1 macrophages and cholesterol-loaded THP-1 cells detected by anti-ABCA1 antibody and mRNA sequencing. Levels are calculated as relative to the protein expression and transcription in THP-1 macrophages (n = 4). Statistical significance calculated using Mann-Whiney U-test or one-way ANOVA supplemented with Tamhane's multiple comparison test. Error bars indicate SD.

