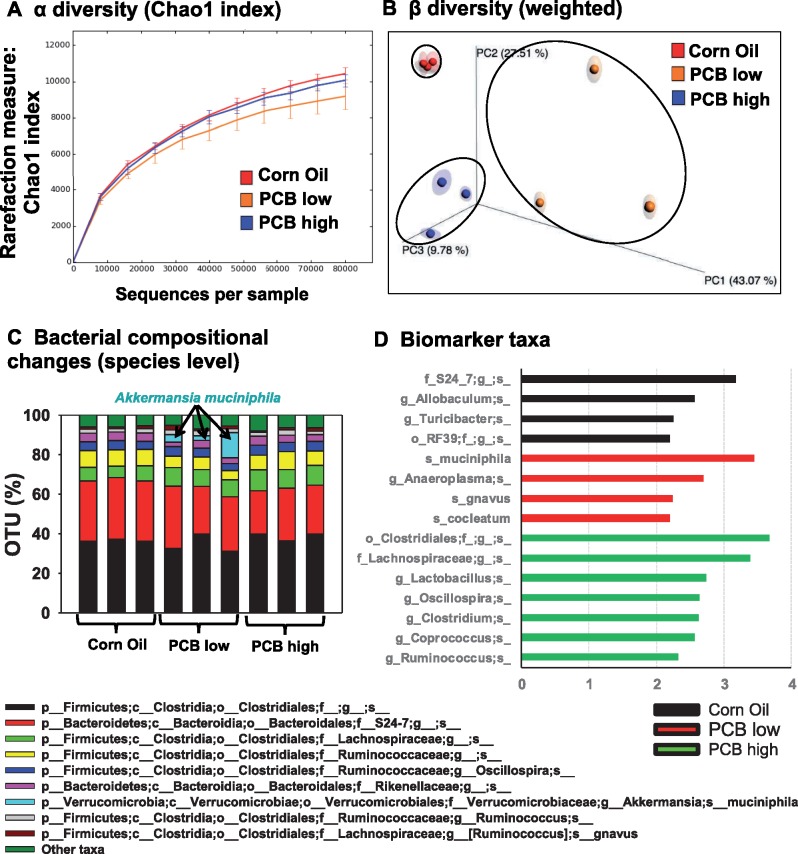
Figure 2.
Alpha (A) and beta (B) diversities of gut microbiota in CV mice exposed to corn oil, the low PCB dose, and the high PCB dose (n = 3 per group). The 16S rRNA sequencing data were analyzed using QIIME as described in the Materials and Methods section. (C) Bacterial compositional changes at the species level in corn oil, low PCB and high PCB dose exposure groups. The top 9 species are shown, whereas the sum of the remaining taxa is displayed as “other taxa” as the 10th category. (D) Microbial biomarker prediction in each exposure group using LDA effect size (LefSe) analysis of the QIIME-generated 16S rRNA OTU table at the species level. Data were analyzed using MicrobiomeAnalyst, MDP. Biomarker bacteria with a LDA score above 2 and p < .05 (indicating a significantly enriched biomarker) were plotted in each exposure group.

