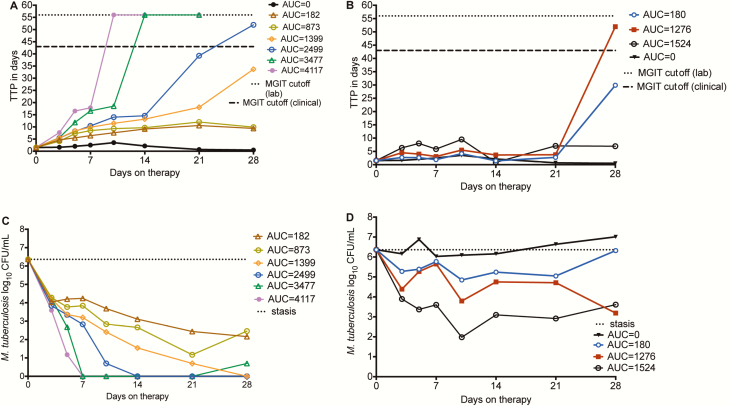
Figure 3.
d-cycloserine microbial kill in the hollow fiber system model of tuberculosis. A, Time to positivity (TTP) as a measure of bacterial burden when d-cycloserine doses were administered daily; the doses are shown as the 0- to 24-hour area under the concentration–time curve (AUC0–24) values. TTP increases as bacterial burden decreases. The highest 2 doses with an area under the concentration–time curve (AUC) of 182 and 273 mg × h/L achieved TTP >56 days, and thus negative culture. The TTP >56 days is a more stringent cutoff point for negative cultures compared to the 42 days used in the clinic, though this varies between clinical laboratories. B, The once-weekly regimens did worse, with TTPs only increasing after 3 weeks; doses are shown as AUC0–24 values. C, When microbial kill was measured using colony-forming units (CFU)/mL, the 2 highest doses achieved negative cultures by day 7, unlike what was seen with TTP. The CFU/mL assay is less sensitive at lower bacterial burdens. D, Based on CFU/mL, the once-weekly dosing schedules demonstrated microbial kill during the first 10 days, then failed, with regrowth after 21 days. The kill slopes were less steep compared to the daily dosing schedule. Doses are shown as AUC0–24 values. AUC, area under the concentration–time curve; CFU, colony-forming units; MGIT, mycobacterial growth indicator tube; TTP, time to positivity.

