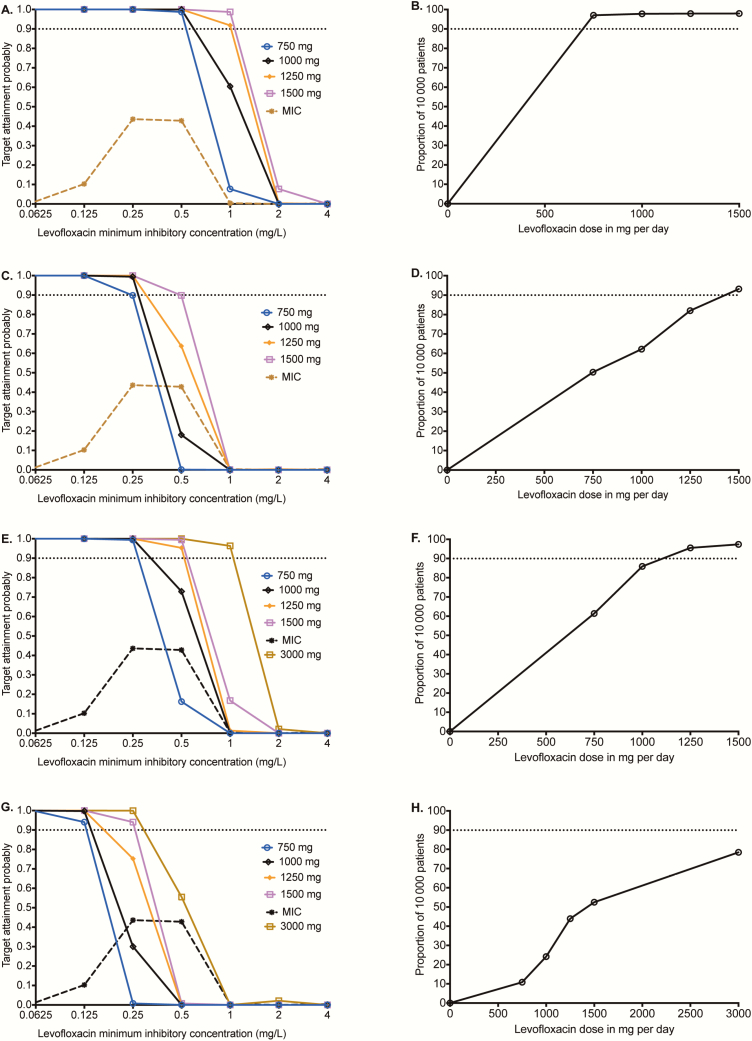
Figure 4.
Monte Carlo experiments of different levofloxacin doses for pulmonary and meningeal tuberculosis. (A) Target attainment probability (TAP) for the exposure associated with 80% of maximal kill (EC80) exposure in pulmonary cavities. At a dose of 1000 mg, TAP falls below 90% above a minimum inhibitory concentration (MIC) of 0.5 mg/L. (B) Proportion of 10000 patients treated with different doses who achieved the EC80 in pulmonary cavities reveals an optimal dose of 1250 mg. (C) TAP of different doses for achieving 0–24 hour area under the concentration-time curve (AUC0-24)/MIC = 360 target exposure associated with resistance suppression in pulmonary cavities. At a dose of 1500 mg, the TAP falls below 90% above an MIC of 0.5 mg/L. (D) The levofloxacin dose that would achieve the exposure associated with resistance suppression in >90% of patients with pulmonary cavities was 1500 mg per day. (E and F) In tuberculous meningitis, the TAP for the EC80 target fell below 90% above an MIC of 0.5 mg/L for all doses, except the 3000 mg a day. (G and H) TAP of different doses in achieving exposure associated with resistance suppression in the cerebrospinal fluid precipitously drops above an MIC of 0.25 mg/L, demonstrating the impact of drug penetration on site of effect. Abbreviation: MIC, minimum inhibitory concentration.

