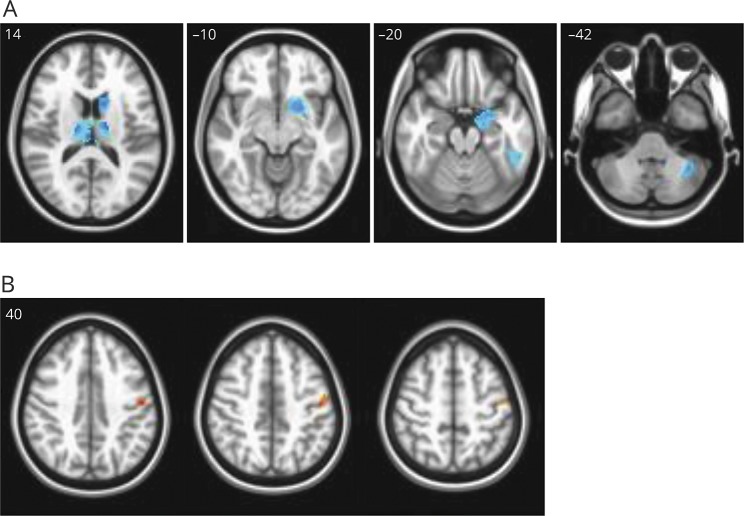
Figure 1. Gray matter differences associated with functional movement disorders (FMDs).
Panels show T1-weighted axial images illustrating regions of increased (A) and decreased (B) gray matter volume in patients with FMD as compared to healthy controls. Group differences are adjusted for differences in age and intracranial volume. p ≤ 0.05, whole brain corrected. Image left is brain right; z coordinates indicated in upper left.

