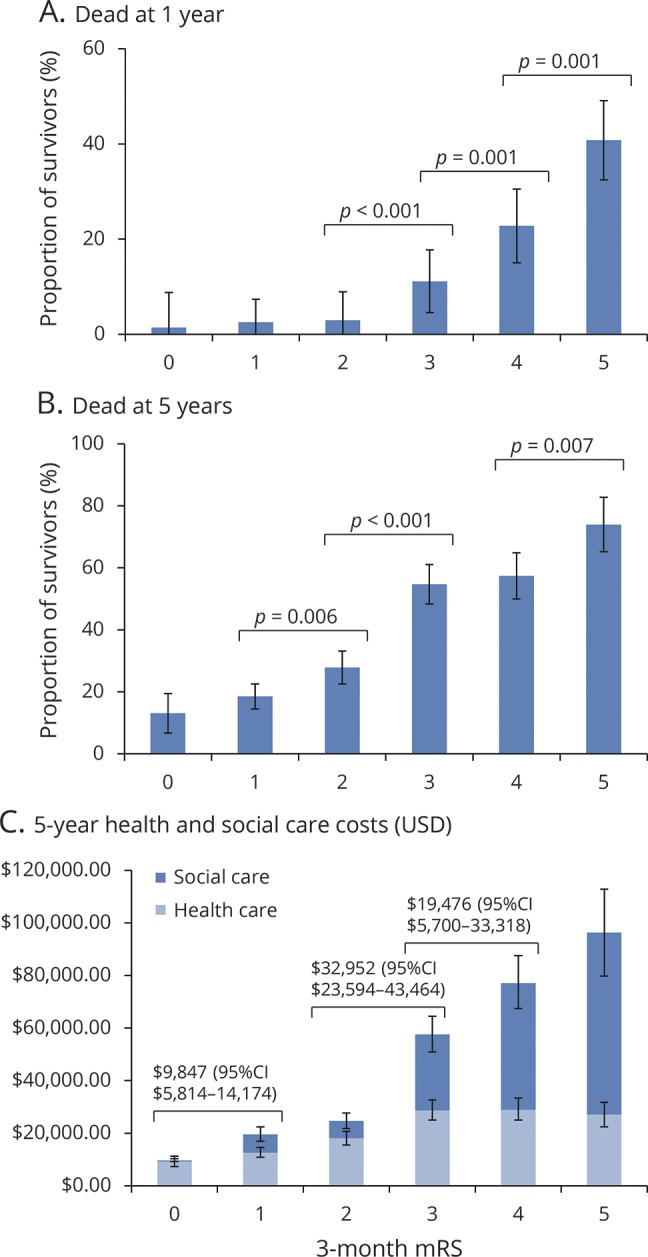
Figure 3. Deaths and health and social care costs in survivors of ischemic stroke, stratified by 3-month mRS scores.

The graphs show the proportion of 3-month survivors with full 5 years of follow-up who were dead at 1 year (A), dead at 5 years (B), and the cumulative 5-year health care costs for all survivors (C). Significant differences between mRS grades are indicated using p values from χ2 analysis (A and B) and mean cost differences with 95% CIs (C). CI = confidence interval; mRS = modified Rankin Scale; USD = US dollars.
