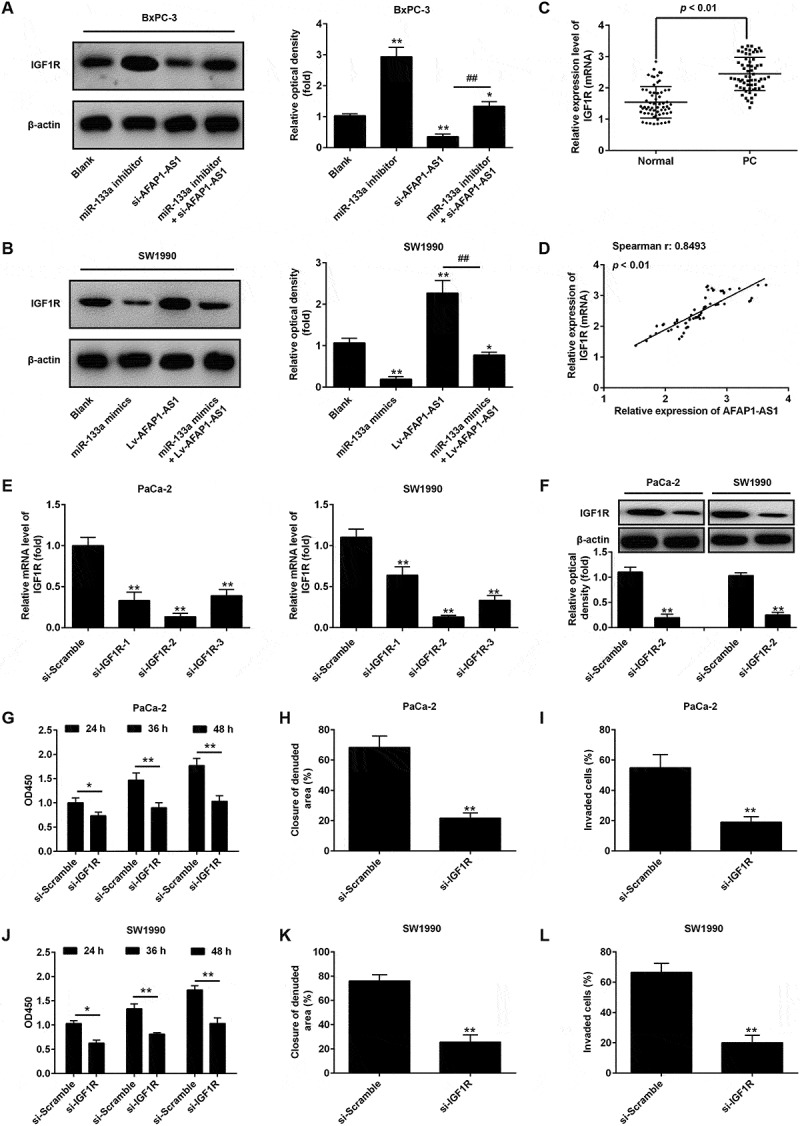
Figure 5.

AFAP1-AS1 increases the expression of IGF1R by acting as a ceRNA of miR-133a. BxPC-3 cells were co-transfected with miR-133a inhibitor and si-AFAP1-AS1, while SW1990 cells were co-transfected with miR-133a mimics and Lv-AFAP1-AS1. Cells were then harvested for Western Blotting. (a) The expression of IGF1R protein was measured by Western Blotting in BxPC-3 cells after co-transfection with miR-133a inhibitor and si-AFAP1-AS1. Bands were quantitatively compared between groups. Data are represented as means ± S.D. from three independent experiments, **p < 0.01 vs. Blank group; ##p < 0.01 vs. si-AFAP1-AS1. (b) The expression of IGF1R protein was measured by Western Blotting in SW1990 cells after co-transfection with miR-133a mimics and Lv-AFAP1-AS1. Bands were quantitatively compared between groups. Data are represented as the mean ± S.D. from three independent experiments, **p < 0.01 vs. Blank group; ##p < 0.01 vs. Lv-AFAP1-AS1. (c) Relative expression level of IGF1R in 60 paired cancerous and peritumoral normal tissues. p < 0.01 vs. Normal tissue group. (D) Spearman’s analysis was used to analyze the relationship between AFAP1-AS1 and IGF1R expression levels in PC tissues (r: 0.8493, p < 0.01). (e, f) qRT-PCR and Western Blot analysis of IGF1R expression levels in PaCa-2 and SW1990 cells after siRNA transfection. Data are represented as the mean ± S.D. from three independent experiments, **p < 0.01 vs. si-Scramble. (g, j) The effect of IGF1R knockdown on cell proliferation was determined by CCK-8 assays. Data are represented as the mean ± S.D. from three independent experiments, *p < 0.05, **p < 0.01 vs. si-Scramble. (H, K) The effect of IGF1R knockdown on cell migration was assessed by wound healing assays. Data are represented as the mean ± S.D. from three independent experiments, **p < 0.01 vs. si-Scramble. (i, l) The effect of IGF1R knockdown on cell invasion was assessed by transwell assays. Data are represented as the mean ± S.D. from three independent experiments, **p < 0.01 vs. si-Scramble.
