Figure 6.

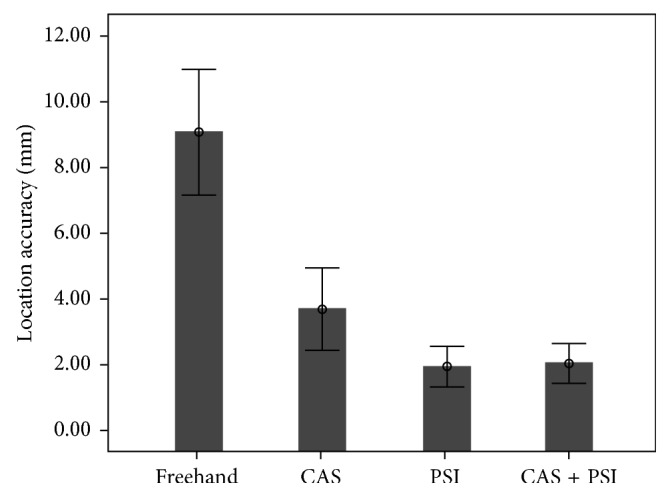
Comparison of location accuracy (mm). Mean values including the lower and upper limits of the 95% confidence interval are shown for all research groups.

Comparison of location accuracy (mm). Mean values including the lower and upper limits of the 95% confidence interval are shown for all research groups.