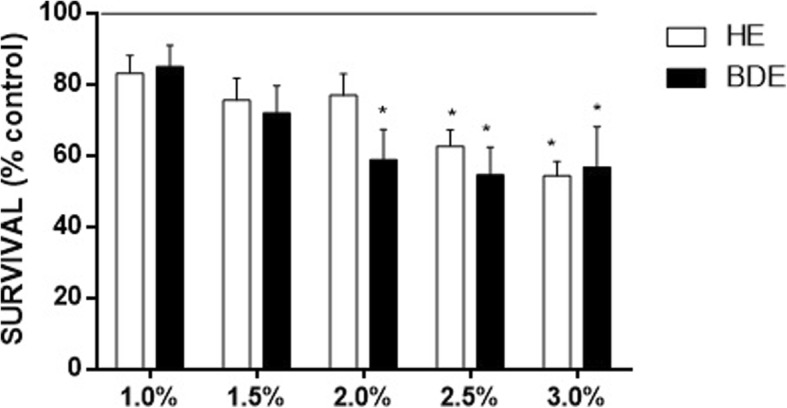
Fig. 1.

Worms survival following 30 min treatment with HE and BDE. The survival was calculated by normalizing the data as percentage of control group. The line indicates the control untreated group (100%). Data are expressed as mean ± SEM. *indicates statistical difference from the untreated group analyzed by two-way ANOVA followed by Tukey post-hoc test (p<0.05)
