
Figure 1:
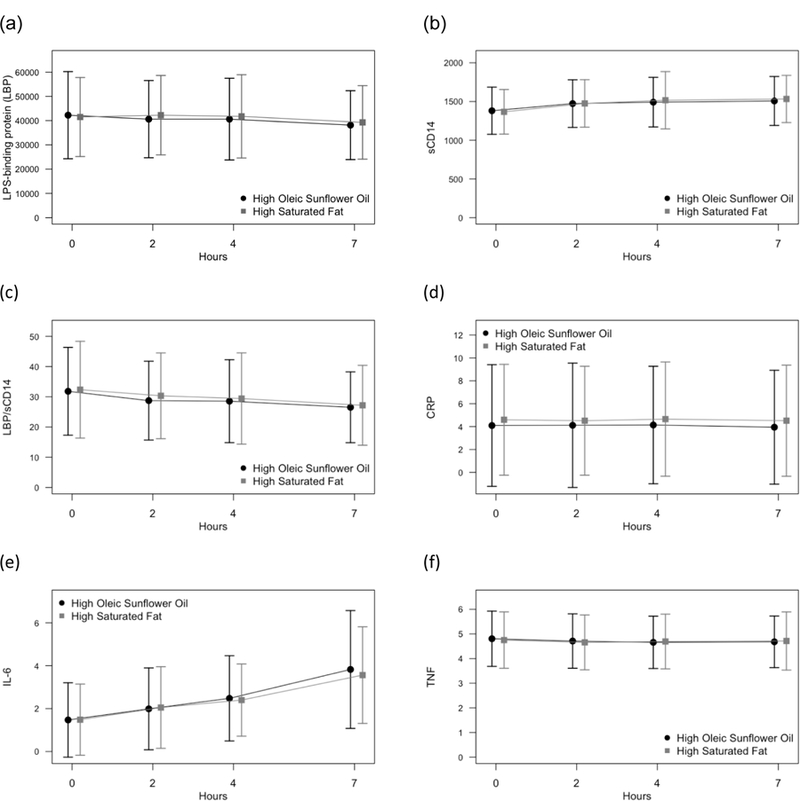
Mean (a) LBP, (b) sCD14, (c) LBP/sCD14 ratio, (d) CRP, (e) IL-6, and (f) TNF across the day, separately by meal type. Error bars show +/− 1 SD.
Official websites use .gov
A
.gov website belongs to an official
government organization in the United States.
Secure .gov websites use HTTPS
A lock (
) or https:// means you've safely
connected to the .gov website. Share sensitive
information only on official, secure websites.
Mean (a) LBP, (b) sCD14, (c) LBP/sCD14 ratio, (d) CRP, (e) IL-6, and (f) TNF across the day, separately by meal type. Error bars show +/− 1 SD.