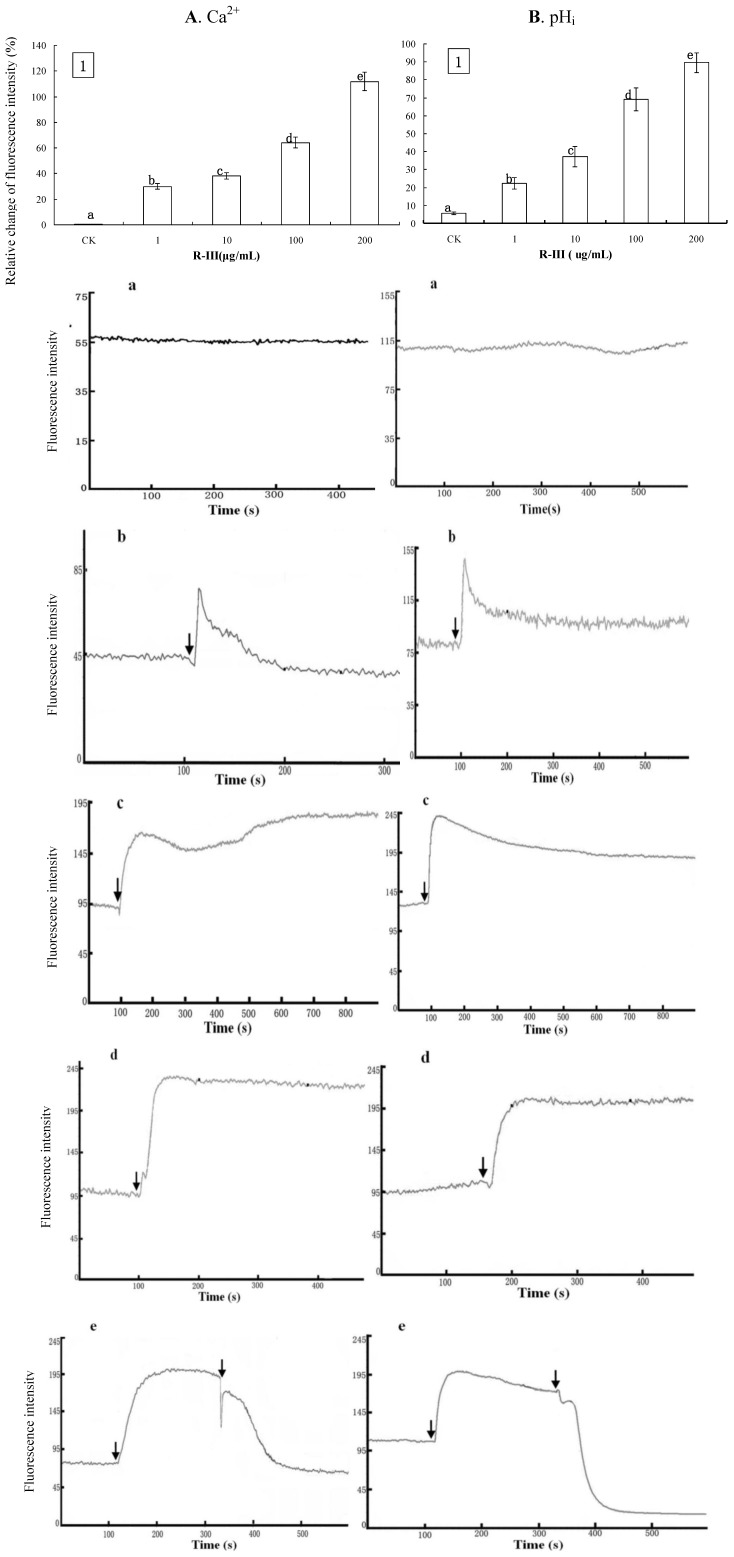
Figure 4.
Effect of R-Ⅲ on [Ca2+]i and pHi in Sf9 cells in presence of Hanks. (A1). changes of [Ca2+]i in Sf9 cells stimulated by R-III at various concentrations as indicated by relative change of Fluo-3AM fluorescence intensity; (B1). Changes of pHi in Sf9 cells stimulated by R-III at various concentrations as indicated by relative change of Snarf1M fluorescence intensity; (A a–d). Dynamic changes of [Ca2+]i indicated by a dynamic trace of Fluo-3AM fluorescence intensity in case of Sf9 cells treated with 0, 1, 100, 200 µg/mL of R-Ⅲ respectively; (B a–d). pHi profile in cells subject to the protocol in (A a–d); (A-e). Dynamic variation of [Ca2+]i in Sf9 cells treated with 100 µg/mL of R-III for two times; (B-e). pHi profile in cells subject to the protocol in (A-e). Arrows indicated the addition of R-Ⅲ.Results of representative experiment derived from three repetitions and 4–6 cells were measured in each repetition. The error bars represent mean ± SEM for data derived from value of relative fluorescence intensity in each time interval. Treatment means sharing the same letter were not significantly different from each other (P < 0.05).

