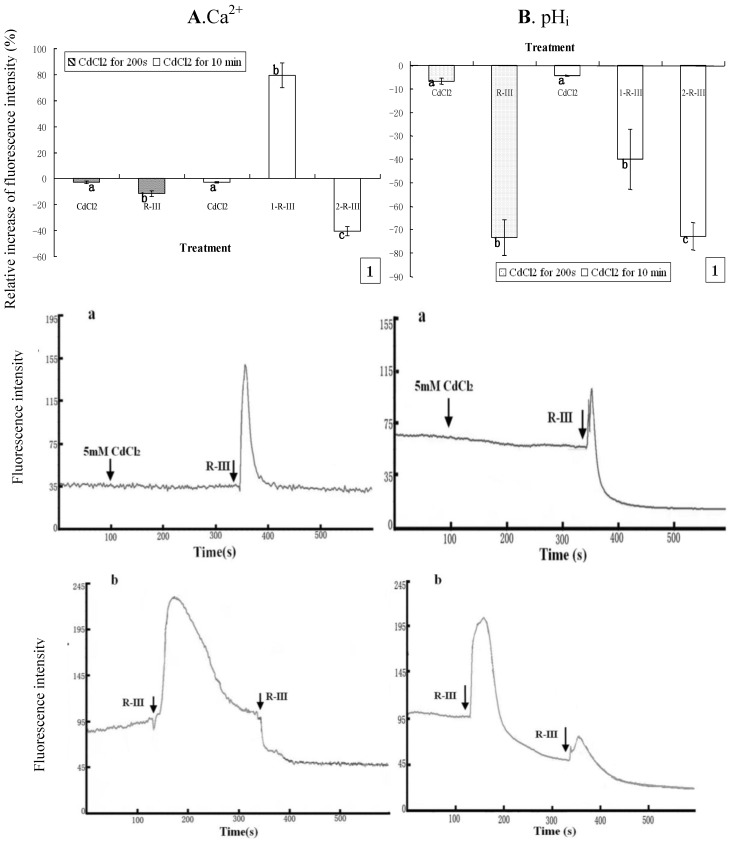
Figure 7.
Effect of Ca2+ channels block on [Ca2+]i and pHi in R-III-induced Sf9 cells in presence of Dhanks. (A1). changes of [Ca2+]i in Sf9 cells treated with 0.5 mM CdCl2 for 200 s and 10 min prior to stimulate with R-III (100 μg/mL), as indicated by relative change of Fluo-3AM fluorescence intensity; (Aa). Dynamic changes of [Ca2+]i in Sf9 cells incubated with CdCl2 (5 mM) for 200 s prior to stimulate with R-III (100 μg/mL); (A-b). Dynamic changes of [Ca2+]i in Sf9 cells incubated with CdCl2 (5 mM) for 10 min prior to stimulate with R-III (100 μg/mL) for two times; (B). pHi profile in cells subjected to the protocol in (A). Results of representative experiment derived from three repetitions and 4–6 cells were measured in each repetition. The error bars represent mean ± SEM for data derived from value of relative fluorescence intensity in each time interval. Treatment means sharing the same letter were not significantly different from each other (P < 0.05). The negative value meant decrease of relative fluorescence intensity in cells.

