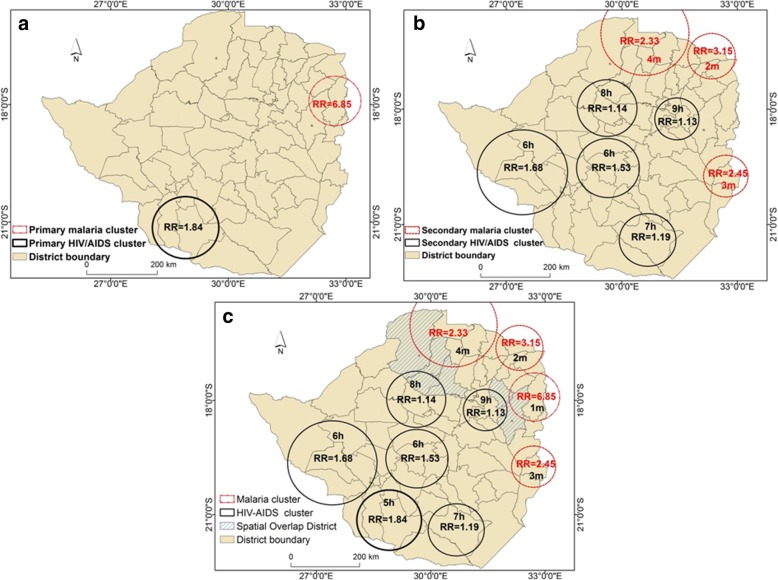
Fig. 2.
Distribution of HIV/AIDS and malaria primary and secondary clusters and their relative risk in Zimbabwe. Black Circles indicate HIV/AIDS clusters while the red circles indicate malaria clusters. Districts with hatching pattern indicate areas in which HIV/AIDS and malaria overlap in space. The letters h and m on the cluster numbers indicate HIV/AIDS and malaria clusters, respectively. RR denotes reletive risk

