Fig. 3.
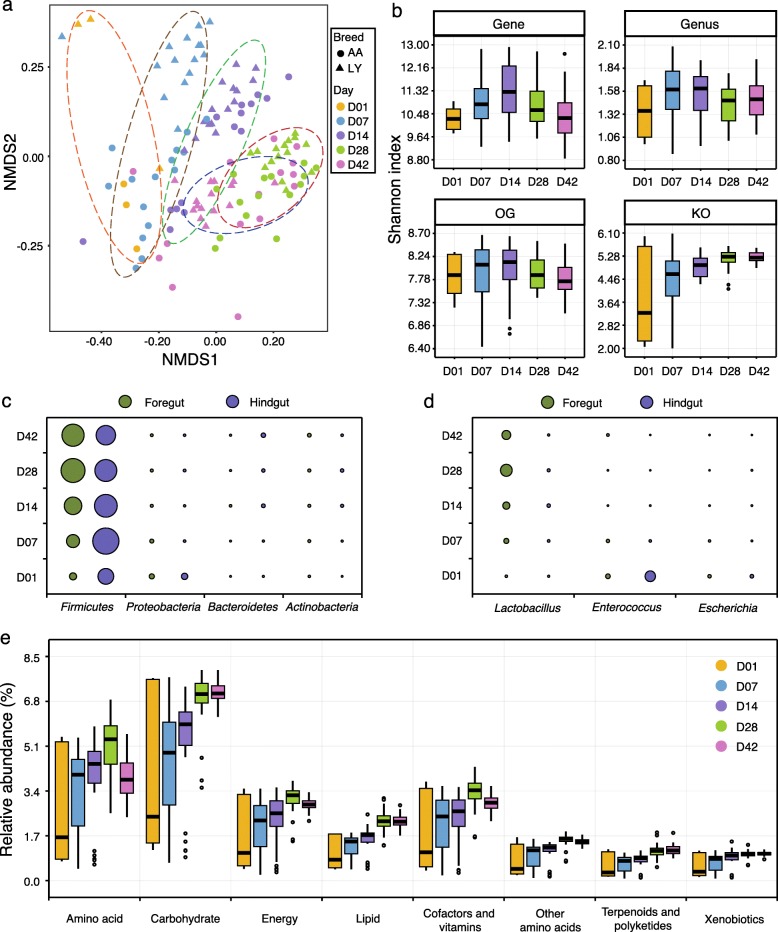
Differences in the chicken intestinal microbiome at different ages. a The NMDS plot of microbial communities in the foregut at different ages. The analysis was based on Bray-Curtis dissimilarities at the species level, and samples were grouped according to the ages. b Microbial diversity (Shannon index) in the foregut at gene, genus, OG, and KO levels. Box plots show median ± interquartile range (IQR) and 1.5 IQR ranges (whiskers), with outliers denoted by dots. The relative abundance changes in major c phyla and d genera at different ages in both the foregut and hindgut. The area of the circles represents the relative abundance of each phylum and genus. e Relative abundance of KEGG metabolic pathways of the microbiome in the foregut at different ages

