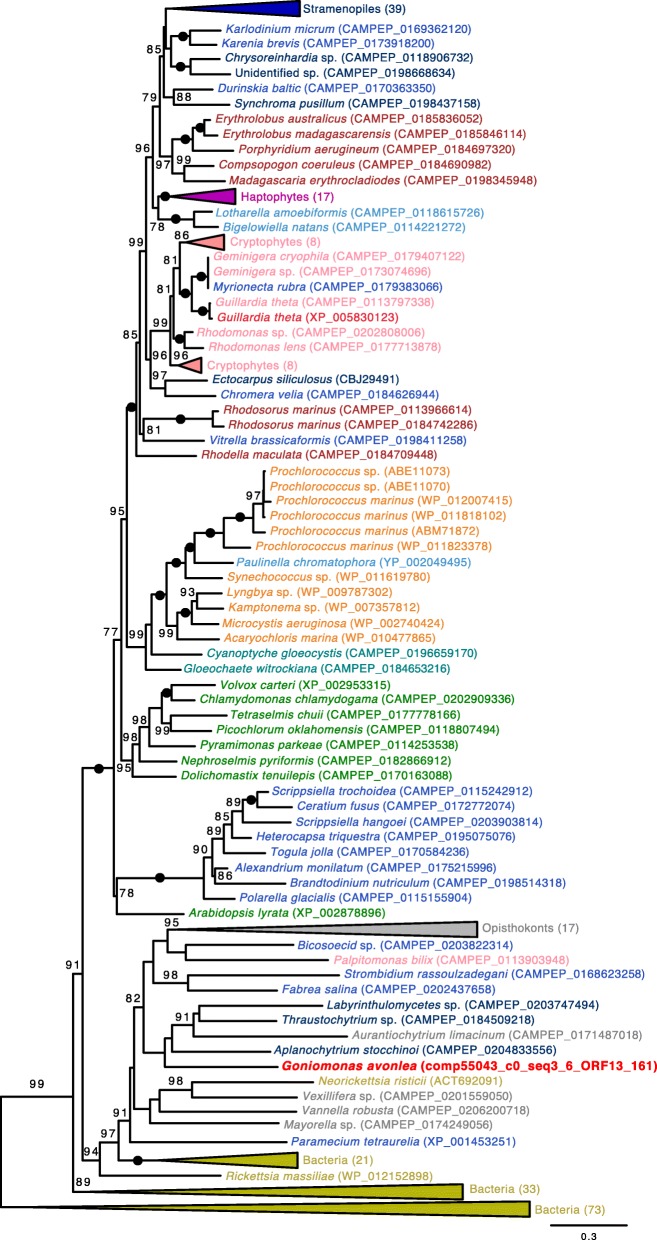
Fig. 3.
Maximum likelihood (ML) phylogeny of tryptophanyl-tRNA synthetase in diverse eukaryotes and prokaryotes. The tree was inferred under the model LG4X (with 100 standard bootstrap replicates) and shows an apparent red algal ancestry for homologs in Cryptophyceae but not in Go. avonlea. Eukaryotic OTUs are colored according to their known or predicted “supergroup” affinities with sequences from Go. avonlea and predicted Gu. theta EGTs [17] highlighted in bright red (Viridiplantae are in green, Glaucophyta are in turquoise, Rhodophyta are in dark red, Cyanobacteria are orange and other Bacteria are in gold, Cryptophyta are in pink, Haptophyta are in purple, Stramenopiles are in dark blue, Alveolata are in blue, Rhizaria are in light blue). The tree shown is midpoint rooted. Black dots indicate maximal support for particular nodes. When not maximal, only bootstrap support values > 70% are shown. The scale bar shows the inferred number of amino acid substitutions per site

