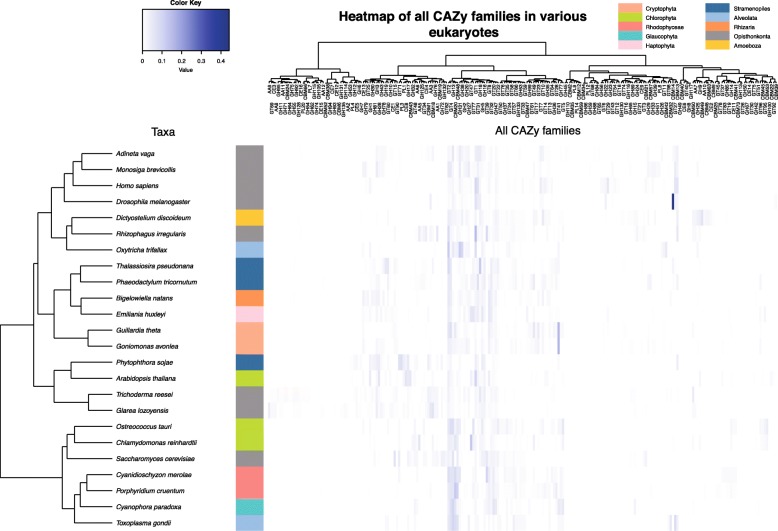
Fig. 7.
Carbohydrate-active enzyme (CAZyme) families in the heterotroph Goniomonas avonlea, the phototroph Guillardia theta, and other eukaryotes. Diagram shows a heatmap of CAZyme prevalence in each taxon (abundance within a particular CAZy family divided by the whole number of CAZy families predicted from the genome); the white to blue color scheme indicates low to high prevalence, respectively. Dendogram shows the relative proximity of taxa, or of the co-occurrence of CAZyme families on the left. We observed a close relationship between Gu. theta and Go. avonlea (salmon), and that Cryptophyta have a set of CAZyme families similar to that seen in other secondarily photosynthetic algae

