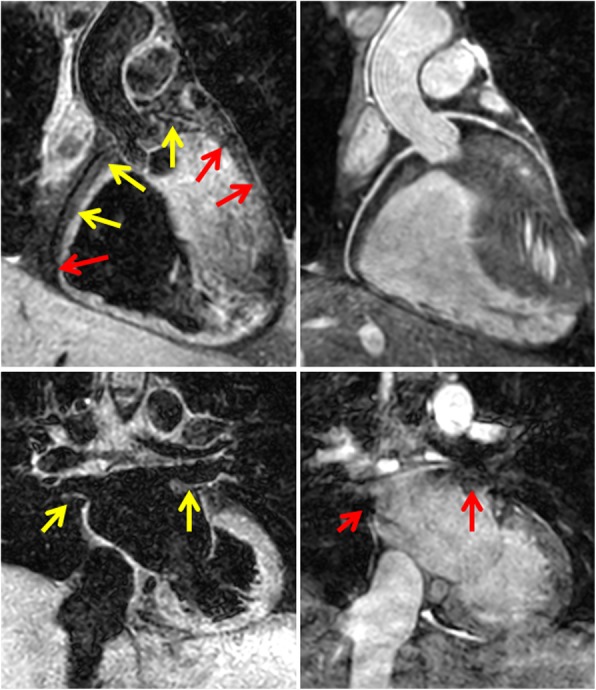
Fig. 4.

3D FSE (left) and 3D bSSFP (right) of a healthy subject, reformatted to visualise the right coronary artery and left anterior descending arteries (top images), and right and left pulmonary veins (bottom images). The proximal coronaries can be visualised with 3D FSE (yellow arrows) while distal arteries are not distinguishable. However, the pulmonary veins are clearly seen in the 3D FSE, unlike 3D bSSFP where flow artifacts hamper visualization
