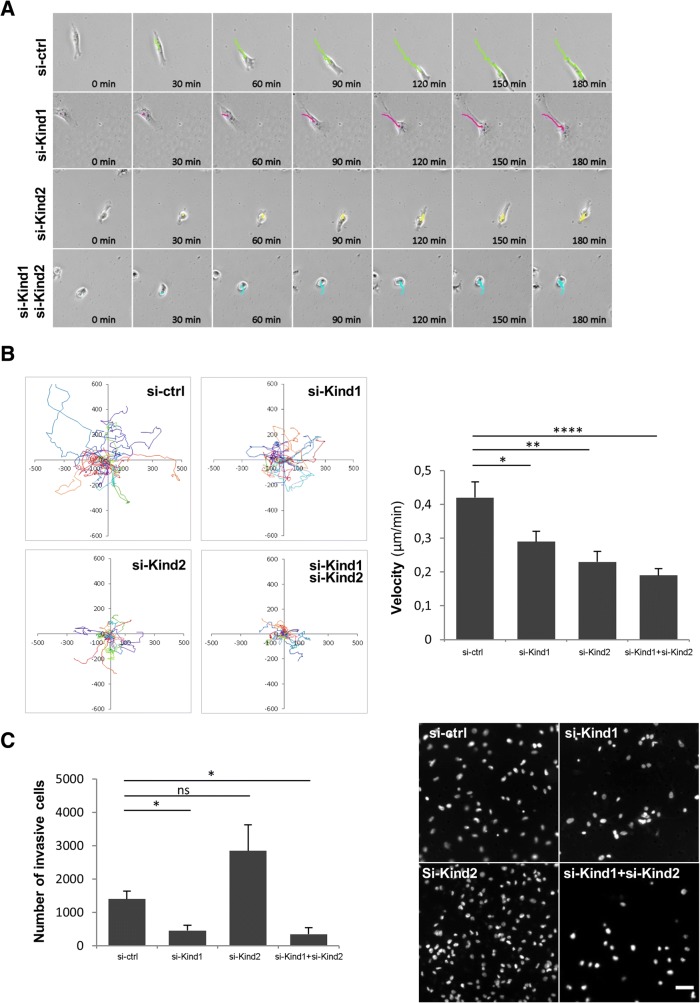
Fig. 2.
Kindlin-1 and Kindlin-2 involvement in breast cancer cell motility. MD-MB-231 cells were transfected with control siRNA (si-ctrl), KIND1 siRNA (si-Kind1), KIND2 siRNA (si-Kind2) alone or in combination (si-Kind1 + si-Kind2) for five days. a Time-lapse imaging was performed for 24 h. Images show representative trajectories travelled by cells during 180 min. b Plots show overlays of the representative trajectories travelled by cells .Velocity was quantified and represented as the mean +/− SEM of values (n = 20 cells tracked by condition). Statistical analysis were performed by a t-test (****p < 0.0001; **p < 0.01; *p < 0.05). Results are representative of experiments performed at least in duplicate. c A transwell cell invasion assay was performed for 24 h. Cells were then counterstained with DAPI and imaged with a fluorescence microscope. The number of invasive cells was quantified and represented as the mean ± SEM of values. Statistical analyses were performed by a t-test (*p < 0.05; ns: not significant). A representative image of three independent experiments is shown for each condition. Scale bar = 50 μm

