Fig. 3.
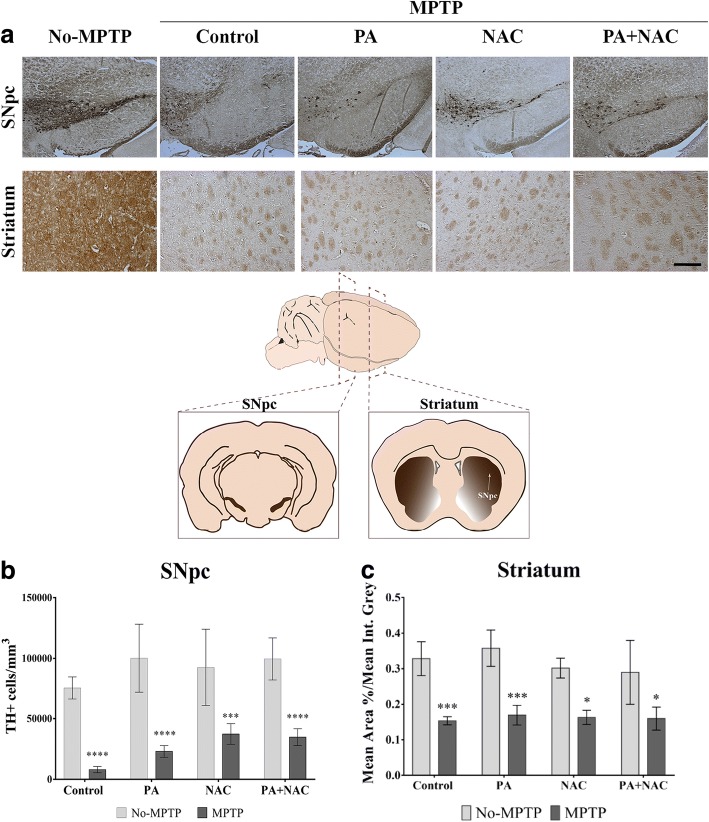
Quantification of TH+ expression in SNpc and striatum. a Representative images from TH immunolabeling in SNpc and striatum (magnification × 10, scale bar = 100 μm). b Quantification of TH+ cells/mm3 in SNpc. Results show that MPTP (****p < 0.0001), MPTP+PA (****p = 0.0001), MPTP+NAC (***p = 0.0006), and MPTP+PA + NAC (****p < 0.0001) have a significant decrease of TH+ cells/mm3 compared to their No-MPTP groups. c Measurement of TH+ expression in striatal fibers. All MPTP mice have a significant decrease compared with their respective control groups: MPTP (***p = 0.0007), MPTP+PA (***p = 0.0004), MPTP+NAC (*p = 0.0143), and MPTP+NAC + PA (*p = 0.0396)

