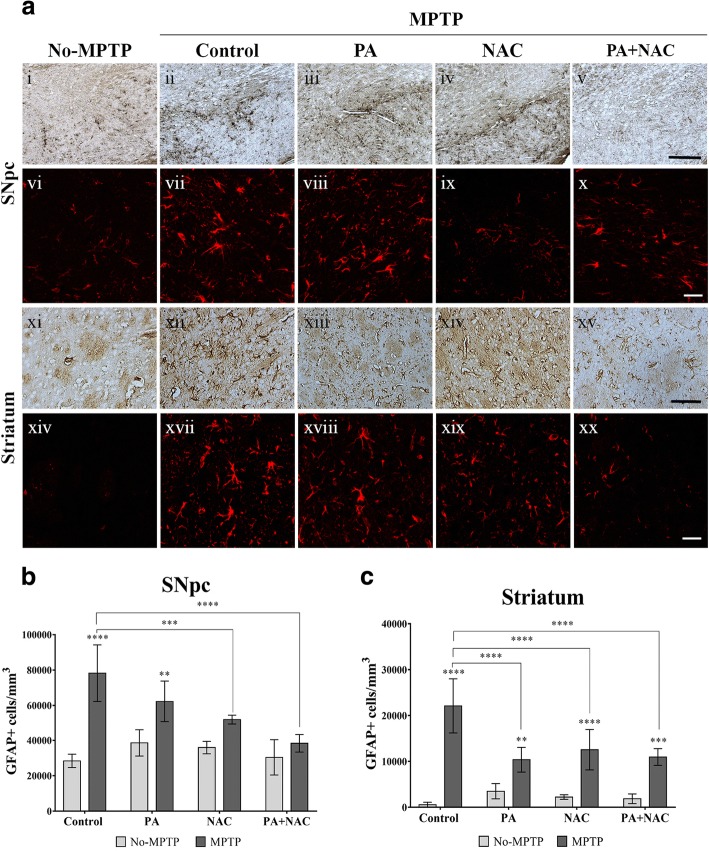
Fig. 5.
Effect of combined treatment on GFAP+ expression in the SNpc and striatum. a Images from immunolabeling of GFAP in the SNpc and in the striatum (magnification × 20 (i–v and xi–xv), scale bar = 50 μm; magnification × 63 (vi–x and xvi–xx, scale bar = 25 μm). b GFAP+ cells density in the SNpc is significantly increase in MPTP (****p < 0.0001) and MPTP+PA (***p = 0.0021) groups compared to No-MPTP groups. Interestingly, a significant decrease in GFAP+ expression were found comparing MPTP+NAC (***p = 0.0008 and MPTP+PA + NAC (****p < 0.0001) with MPTP group. c In the striatum, MPTP (****p < 0.0001), MPTP+PA (**p = 0.0060), MPTP+NAC (****p < 0.0001), and MPTP+PA + NAC (***p = 0.0002) express significant increase in GFAP+ cells density comparing with their respective No-MPTP groups. As in the SNpc, significant decrease were found between MPTP+PA (****p < 0.0001), MPTP+NAC (***p = 0.0002), and MPTP+PA + NAC (****p < 0.0001)

