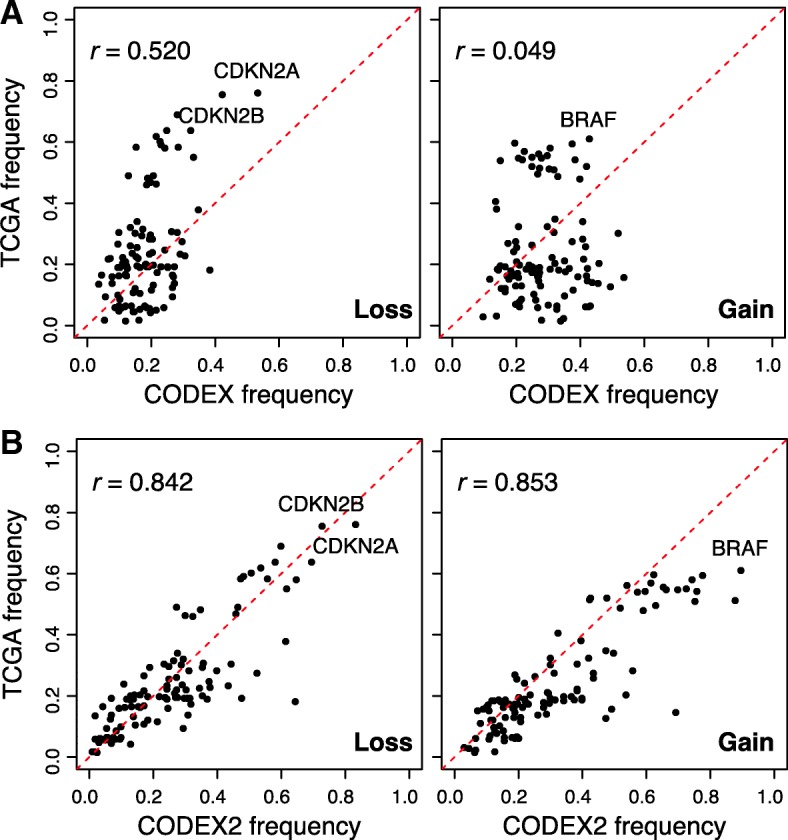
Fig. 5.

Assessment of profiled CNVs in the melanoma cohort with a comparison to TCGA. CNVs are separated by states: losses on the left panels and gains on the right panel. Each dot corresponds to one gene in the targeted sequencing panel. CNV frequencies detected by a CODEX and b CODEX2 from the melanoma cohort is compared to the TCGA cohort with CODEX2 having a drastically higher correlation
