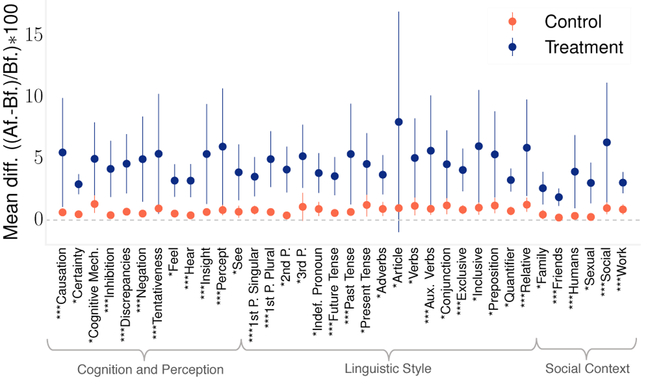
Figure 8:
Differences in cognitive measures between the Treatment and Control groups following CR exposure, based on usage of LIWC categories. The vertical lines represents 95% confidence interval range, and the dot shows the mean. Statistical significance is reported based on Welch t-test. p-values are adjusted using FDR correction (*p < 0.05, * * 0.001 < p < 0.01, * * *p < 0.001).

