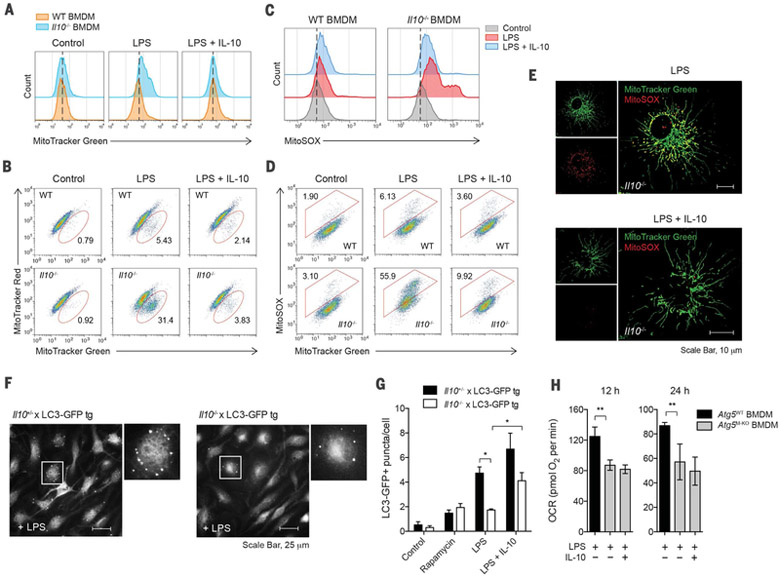
Fig. 2. IL-10 prevents accumulation of dysfunctional mitochondria and production of mitochondrial ROS via the induction of mitophagy.
(A to E) WT or Il10−/− BMDMs stimulated without (control) or with LPS in the presence or absence of IL-10 for 24 hours. Total mitochondrial mass was analyzed by flow cytometry in cells labeled with MitoTracker Green (A). Mitochondrial membrane potential (Δψm) and ROS were analyzed in cells labeled with MitoTracker Green and MitoTracker Red (B), or with MitoSOX (C) and (D), respectively. Representative microscopic images show mitochondrial ROS production in Il10−/− BMDMs labeled with MitoTracker Green and MitoSOX (E). Scale bars, 10 μm. (F and G) Quantification of LC3-GFP punctate formation in IL-10–sufficient (Il10+/−) or –deficient (Il10−/−) LC3-GFP tg BMDMs stimulated as in (A) or with rapamycin for 6 hours. Representative microscopic images show LC3-GFP punctate in higher magnification of the indicated area (box) (F). Quantification based on counting LC3-GFP punctate per cell in the field of view (G). (H) OCR in BMDMs generated from Atg5flox/flox (Atg5WT) or Atg5flox/flox LysM-Cre (Atg5M–KO) mice and stimulated as in (A) for the indicated times. All values are means ± SD of at least three independent experiments. Student’s t test (unpaired); *P < 0.05, **P < 0.01.

