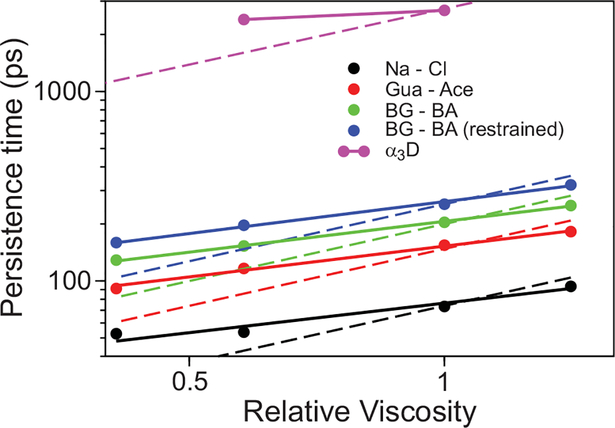
Fig. 7. Viscosity dependence of persistence times for a number of ion pairs.
The persistence time is reported on a logarithmic plot as a function of viscosity relative to TIP3P for the Na…Cl ion pair (black), the guanidinum…acetate ion pair (red), the butyl-guanidinum…butyric acid ion pair (green, representing the side chains of Arg and Glu), a butyl-guanidinum…butyric acid ion pair where the terminal carbon atoms have been restrained at a distance of 10 Å (blue), and the Arg…Glu/Asp salt bridges in the α3D transition path (purple). A power-law fit with exponents ranging between 0.51 and 0.56 is reported in solid lines, while the exponent of 1.0 predicted by hydrodynamic Kramers’ theory is shown as a dashed line.

