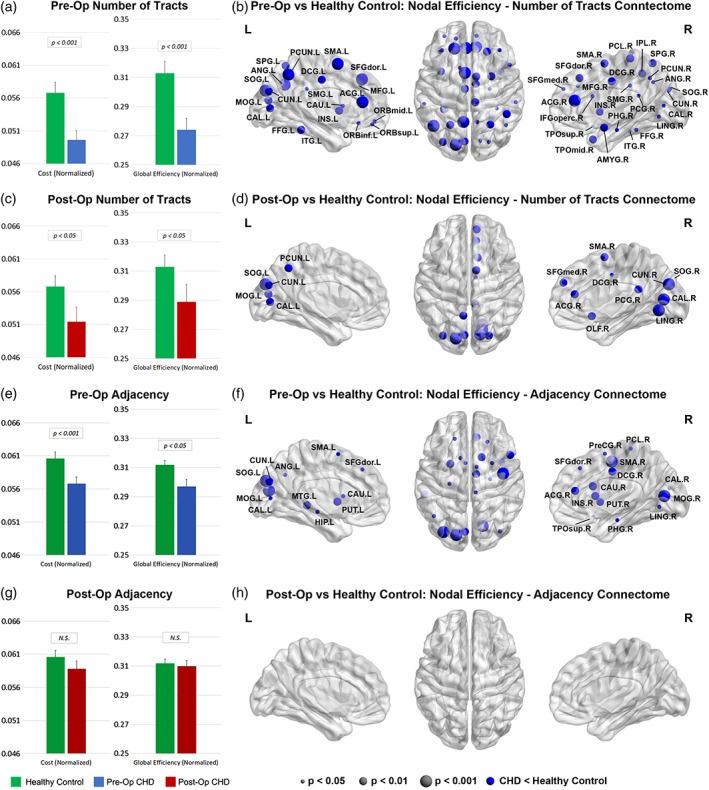
Figure 4.

Comparisons between CHD neonates pre‐ and postoperatively versus normal healthy controls: Comparison of network cost and global efficiency (values normalized to unity average graph weight) for # tracts connectome (a, c) and adjacency connectome (e, g); comparison of nodal efficiency (all regions significant at FDR‐corrected q < 0.05) for # tracts connectome (b, d) and adjacency connectome (f, h) [Color figure can be viewed at http://wileyonlinelibrary.com]
