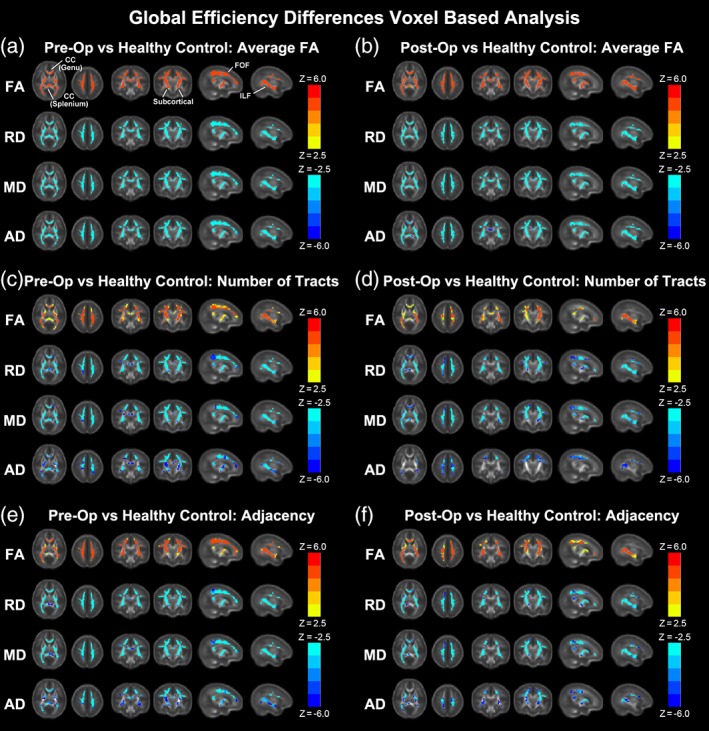
Figure 6.

Correlation of DTI metrics (FA, RD, MD, AD) with global efficiency for preoperative CHD (a, c, e) and postoperative CHD (b, d, f) for average FA connectome (a, b), # of tracts connectome (c, d) and adjacency connectome (e, f) (hot colors = positive correlation, cold colors = negative correlation, all regions significant at FWE‐corrected p < .05) [Color figure can be viewed at http://wileyonlinelibrary.com]
