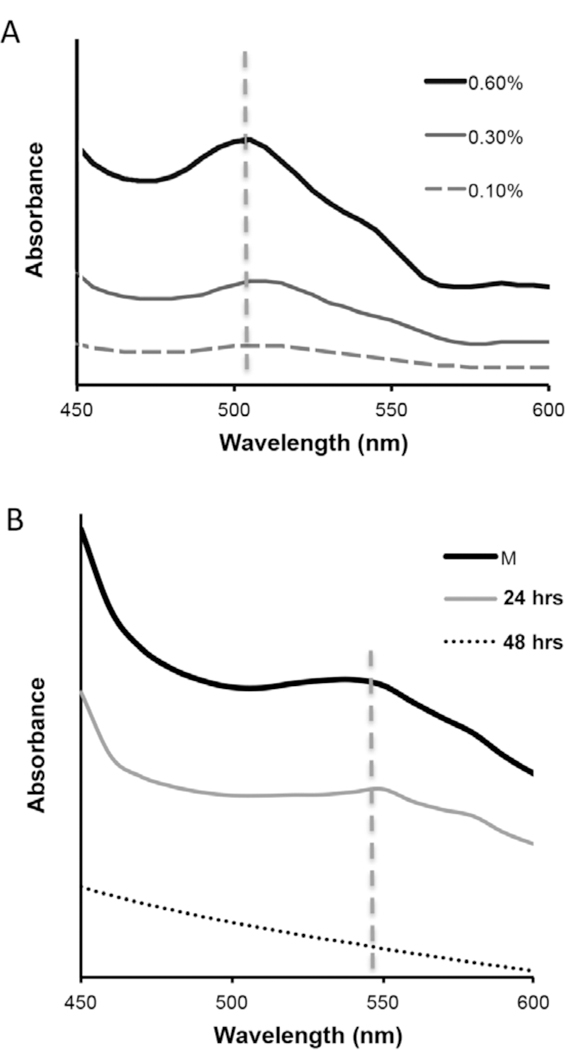
Figure 2:

Representative visible light absorbance spectra for myoglobin solutions (A) and skeletal muscle tissue samples (B). The myoglobin absorbance peak (505±4nm) decreased as protein concentration was diluted from a high of 0.6% (in PBS) to a low of 0.1%. A less pronounced absorbance shoulder (541±7nm) was observed for whole muscle tissue samples. The absorbance shoulder for whole muscle samples (M) was similarly reduced as muscle samples were incubated in decellularization solution (1% SDS) for either 24 or 48 hours.
