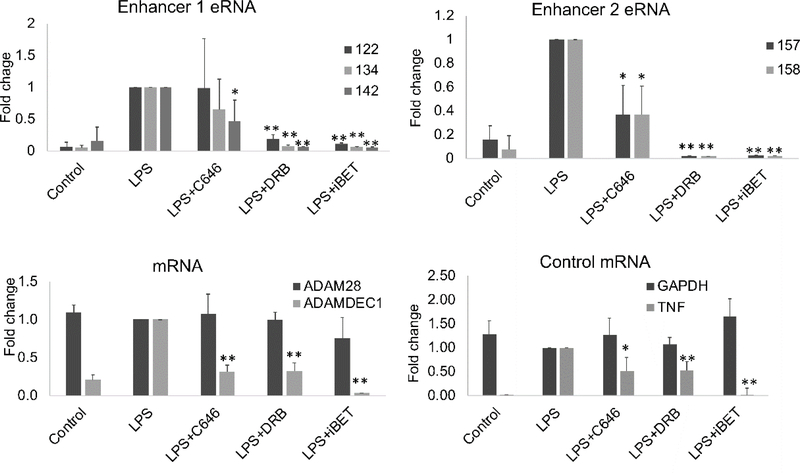
Figure 6. The effect of chromatin inhibitors on transcript levels.
Primary monocytes from healthy controls were pretreated with 20μM C646, 40μM DRB or 10 μM iBET for 30 minutes before adding 1μg/ml LPS. Total RNA was isolated and qRT-PCR was used to measure the enhancer RNA or mRNA level. DRB and iBET uniformly led to diminished RNA levels. The effect of C646 was more variable (n=4, error bars represent SD, * indicates p<0.05, ** p<0.01). The y-axis represents fold change over LPS-treated cells.

