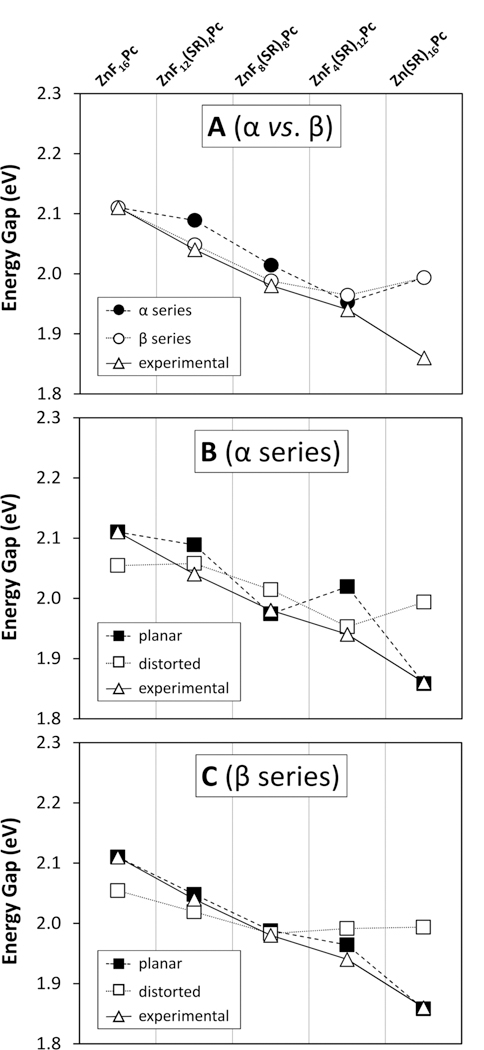
Figure 8.

Calculated and experimental HOMO—LUMO energy gaps of various model Pc compounds. In all three panels, the open triangles (Δ) indicate the experimentally observed energy gaps calculated by converting the peak absorbance wavelengths to eV and adding a constant factor of 0.260 eV. This factor is an ad hoc correction which represents the difference between the calculated and observed energy gaps for ZnF16Pc. The top panel (A) shows a comparison of gap energies for α (filled circles: ●) and β (open circles: ○) substituted Pcs. The middle and bottom panels show comparisons of gap energies for planar (filled squares: ■) and distorted (open squares: □) geometries for α (middle panel, B) and β (bottom panel, C) substituted compounds.
