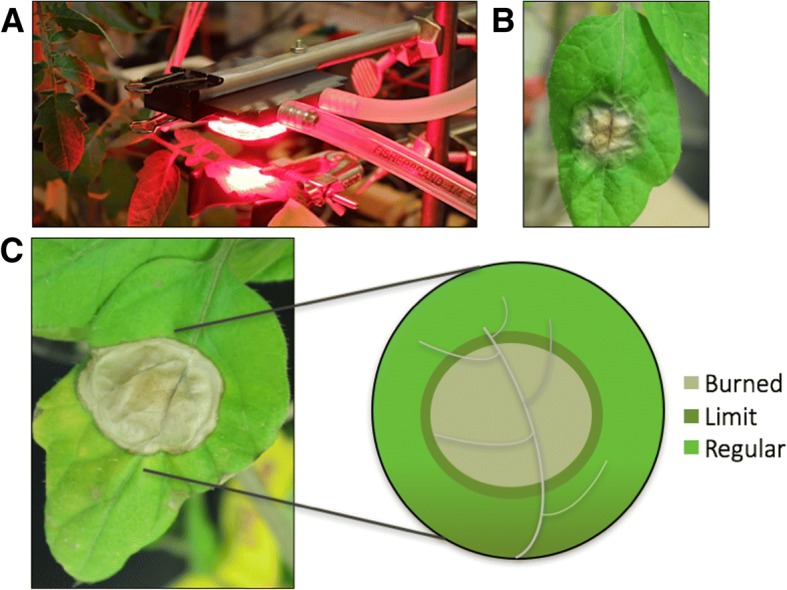
Fig. 1.

LED light treatment schematic. (a) Light treatment on tomato leaves using high-intensity deep-red (655 nm) LED light at 24,000 μmol m− 2 s− 1 (b) Tomato leaf after high-intensity light treatment (c) Photo of the leaf after the 10-days period after the high light treatment and sampling zone scheme: Burned, Limit, and Regular
