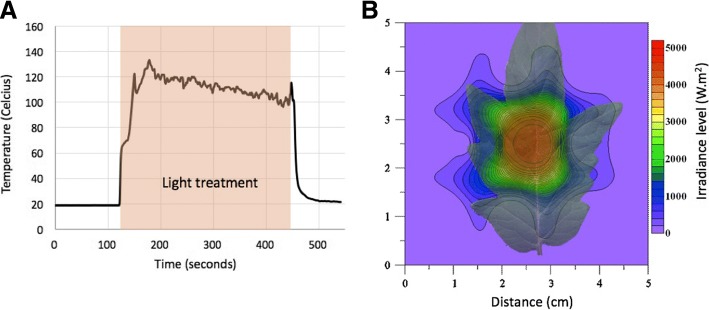
Fig. 2.
Light treatment temperature and light measurements. (a) Leaf temperature measurement by thermocouple (0.03 mm, type T, Omega Engineering Canada). Data points collected every second before, during and after light treatment. The red arrow indicates the duration of the light treatment (~ 5 min). (b) Light mapping with a projected tomato leaf showing the irradiance distribution on the tomato leaf generated by the high-intensity light treatment with the red LED. The inner circle shows the area corresponding to the Burned sample. The average of three biological replicates is reported

