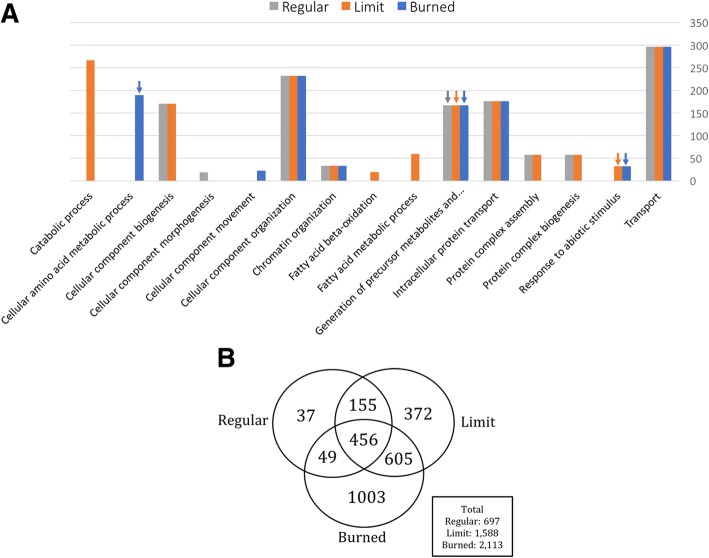
Fig. 3.
Quantitative functional enrichment of the detected proteins expression ratios and Venn diagram of differentially abundant proteins. a Statistically differentially abundant proteins (p < 0.05) from tomato leaves recovered from light-induced heat stress (Burned, Limit, and Regular) grouped in a Venn diagram. b Proteins present in samples Burned, Limit, and Regular were assigned GO-slim sub-categories of the biological processes category by the PANTHER enrichment test. Bonferroni correction was applied for multiple testing. Of the total 3994 proteins, 3873 were mapped to a sub-category, the expression ratios were used to weight the representation of the sub-category regarding the overall expression, y-axis show number of proteins. Only significant matches (p < 0.05, Wilcoxon Rank-Sum test) top 15 categories are shown. The arrows indicate that the protein expression is shifted towards smaller values than the overall expressions. Notable trends are the high proportion of protein expression related to the cellular process in the Regular sample, when compared to Burned and Limit samples

