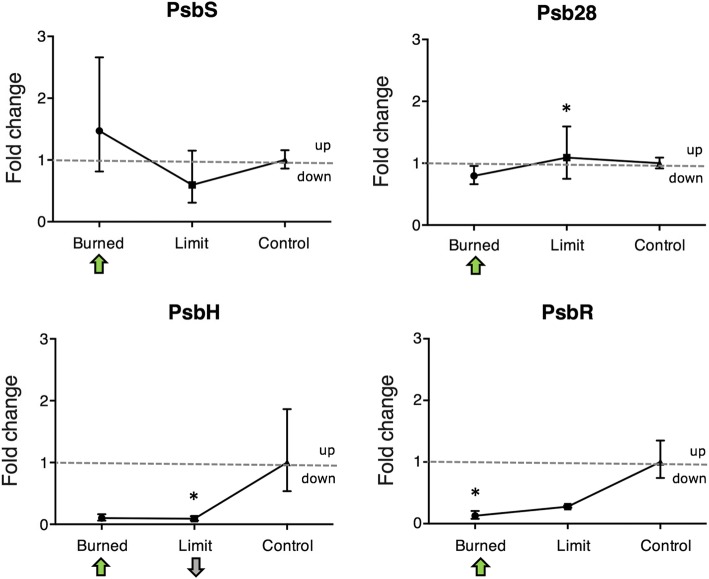
Fig. 5.
Comparison of transcription and translation levels of genes of interest. mRNA fold changes of PsbH, PsbR, Psb28, and PsbS in the Limit, Burned and control detected by RT-qPCR. Controls used were clat and PP2Acs. The data were analyzed by ANOVA and was adjusted for multiple comparison of the means with a Tukey test at p = 0.05 significance level. Statistically significant differences from the control are indicated by *. Error bars show standard deviations with n = 6 replicates. Arrows indicate the direction of the significant protein fold (green, high abundance, grey, low abundance), the absence of arrows indicates no change in the protein abundance between sample and control

