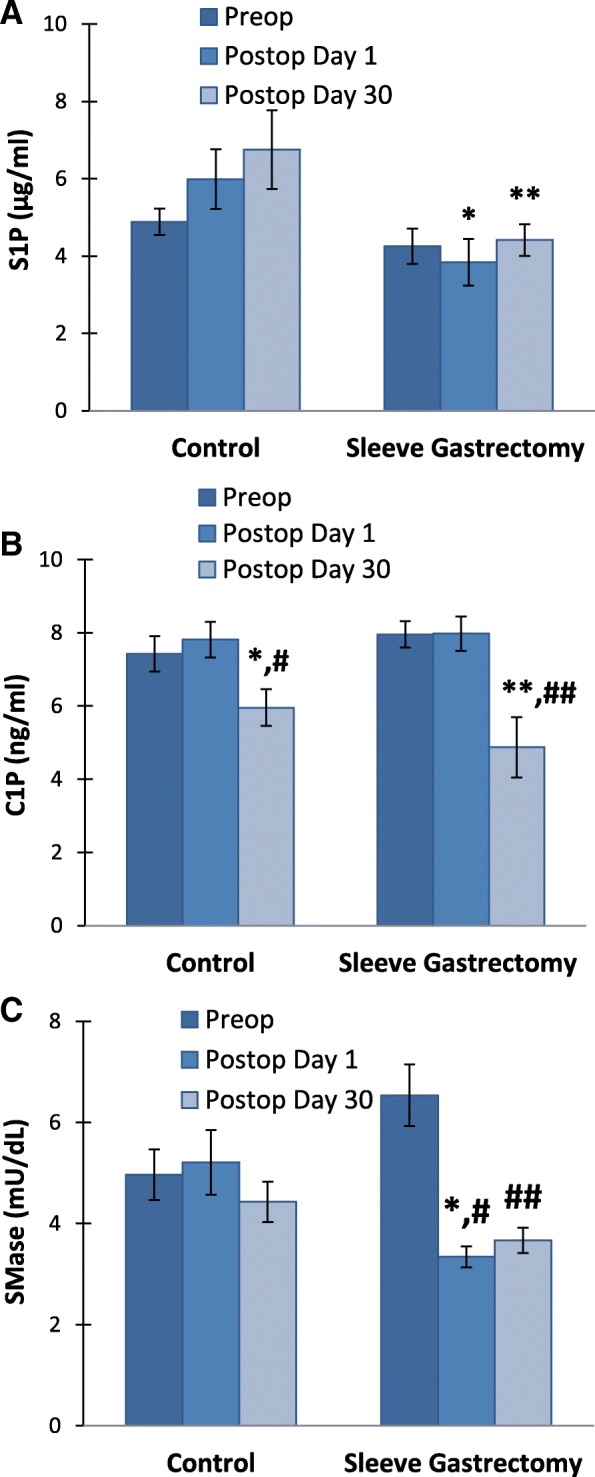
Fig. 4.

a Serum sphingosine 1 phosphate (S1P) levels. Values measured in control group (n = 15) and LSG patients (n = 20). All values are mean ± SEM.*, p = 0,013 vs. **, p = 0,029 vs. control postop day 30. Statistical analysis was done by Mann-Whitney Rank Sum Test. b Serum ceramide-1-phosphate (C1P) levels. Values measured in control group (n = 15) and LSG patients (n = 20). All values are mean ± SEM *, p = 0,013 vs. control preop. Statistical analysis was done by Wilcoxon Signed Rank Test. #, p = 0,020 vs. control postop day 1. Statistical analysis was done by paired t test. **, p = 0,004 vs. sleeve gastrectomy preop. Statistical analysis was done by Wilcoxon Signed Rank Test. ##, p = 0,005 vs. sleeve gastrectomy postop day 1. Statistical analysis was done by Wilcoxon Signed Rank Test. c Serum neutral sphingomyelinase (SMase) activity. . Values measured in control group (n = 15) and LSG patients (n = 20). All values are mean ± SEM. *, p = 0,021 vs. control postop day 1. Statistical analysis was done by Mann-Whitney Rank Sum Test. #, p < 0,001 vs. sleeve gastrectomy Preop. ##, p = 0,002 vs. sleeve gastrectomy Preop
