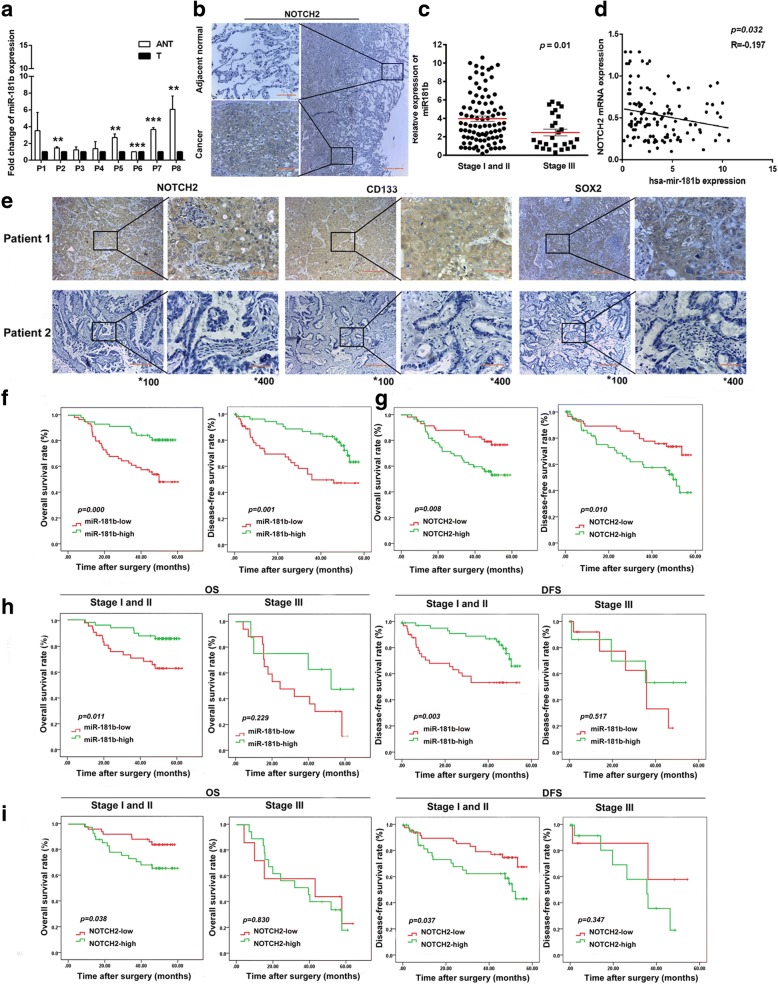
Fig. 6.
The clinical relevance of miR-181b and Notch2 in NSCLC. a miR-181b expression in all 8 NSCLC tumour specimens (T) compared with paired adjacent non-tumour (ANT) tissue as determined by qPCR. b Immunostaining images show Notch2 in tumour tissue and corresponding adjacent non-cancerous tissue. c miR-181b expression measured by qPCR in NSCLC patients at different disease stages. d A statistically significant inverse correlation between miR-181b and Notch2 mRNA levels in NSCLC tissues. e The expression of Notch2, CD133, and SOX2 in tumour tissues from 2 patients is shown by IHC. f, g OS and DFS curves for the high miR-181b expression group and the low miR-181b expression group, which were further analysed in different stages. h, i OS and DFS curves for the high-Notch2 expression group and the low-Notch2 expression group, which were further analysed in different stages. Data are presented as the mean ± SD. **p < 0.01; ***p < 0.001

