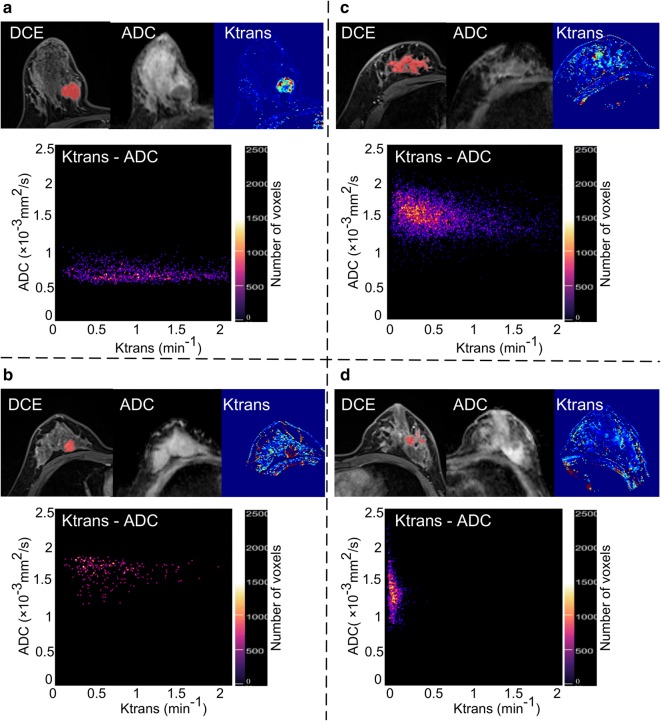
Fig. 1.
Scatter plot of the 2D histogram. The last phase of DCE imaging, realigned ADC, Ktrans, and Ktrans-ADC 2D histogram map of four malignant and benign breast lesions (a: invasive ductal carcinoma, b: fibroadenoma, c: ductal carcinoma in situ, and d: mastitis) are shown in this figure, in which a, b show the case that Ktrans alone fails to differentiate between malignant and benign lesions, but ADC resolves the ambiguity, while c, d show the opposite case that ADC fails to differentiate between malignant and benign lesions, but Ktrans resolves the ambiguity

