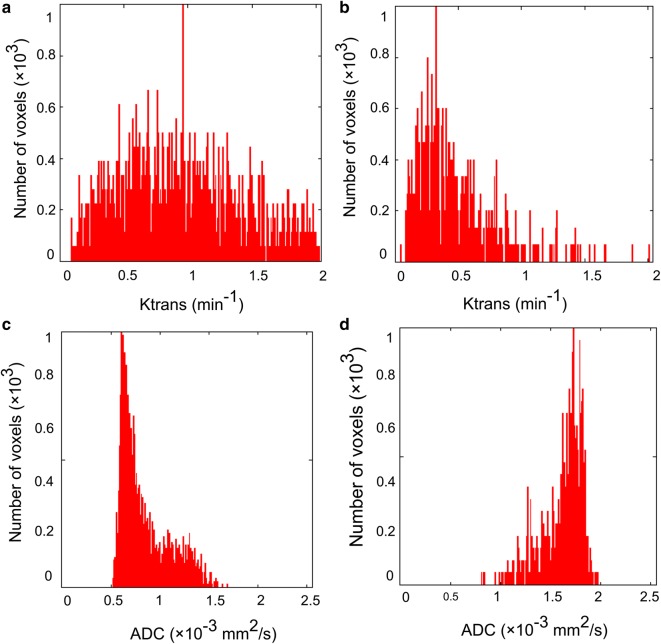
Fig. 2.
Single parametric histogram. According to the Ktrans and ADC histograms of an invasive ductal carcinoma (a, c) and a fibroadenoma (b, d), the kurtosis is (a 3.60; b 7.56, c 2.58; and d 5.87), while the skewness is (a 1.03; b 1.82; c 0.84; and d − 1.45). For the Ktrans histogram curves, b shows a sharper peak and leans more to the left, while for the ADC histogram curves, d seems slightly steeper and leans to the right, and c leans to the left

