
Figure 5.
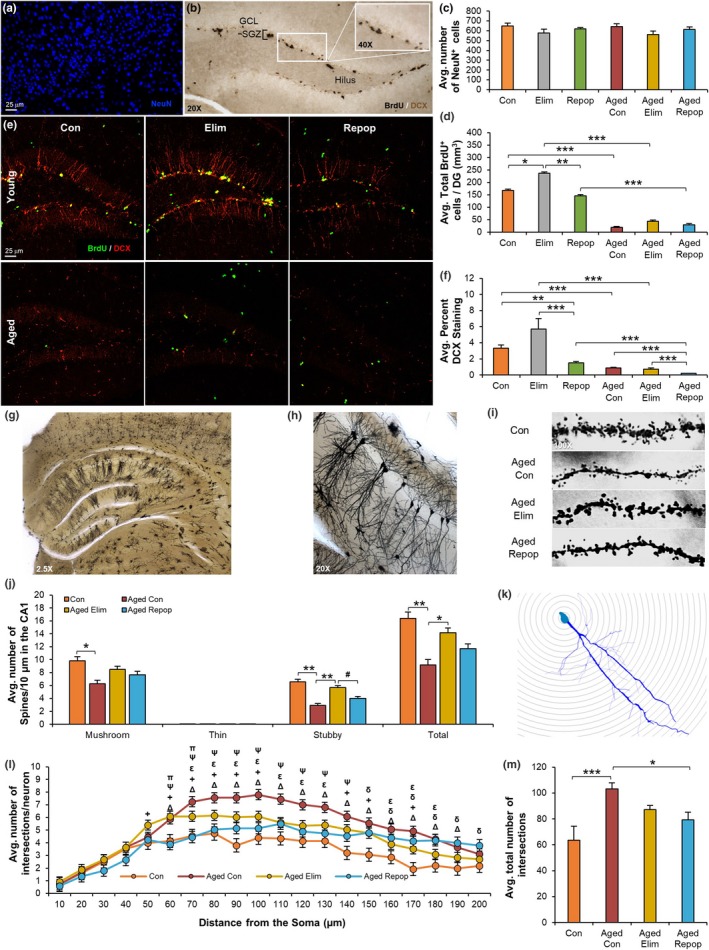
Microglial Elimination and Replacement Modifies Neurogenesis and Neuronal Morphologies. (a) Immunostaining for NeuN (neurons) in cortices from young control (Con), young eliminated (Elim), young microglia‐repopulated (Repop), aged control (Aged Con), aged eliminated (Aged Elim), and aged microglia‐repopulated (Aged Repop) mice. (c) Quantification of (a). (b) Representative image of 5’bromo‐2’‐deoxyuridine (BrdU) staining. (d) Quantification of BrdU+cells in the dentate gyrus (DG). (e) Immunostaining for BrdU (green) and doublecortin (DCX, red) in the DG. (f) Quantification of DCX from (e). (g–m) Golgi staining was performed (n = 3–5 mice/group) on Con, Aged Con, Aged Elim, and Aged Repop mice. Representative 2.5×, 20×, and 100× images of the hippocampus, demonstrating impregnation of neurons (g), dendritic branches (h), and CA1 pyramidal neurons (i) with Golgi stain. (j) Quantification of dendritic spine densities from CA1 neurons. (k) Representative image of a traced neuron and Sholl ring analysis. (l) Average number of dendritic intersections, plotted as distance from soma. (m) Treatment averages from (l). Data presented as means ± SEM. Statistical significance indicated as *p < 0.05, **p < 0.01, and ***p < 0.001 with statistical trends as # p < 0.10. Comparisons for (l): ΔCon versus Aged Con; +Con versus Aged Elim; δCon versus Aged Repop; εAged Con versus Aged Elim; ΨAged Con versus Aged Repop; πAged Elim versus Aged Repop