
Figure 4.
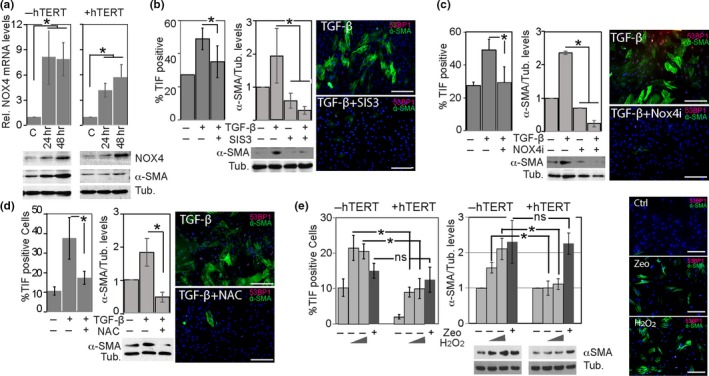
TGF‐β1‐induced transdifferentiation is mediated by Smad3/NOX4‐dependent ROS production and telomere dysfunction. (a) Normal BJ fibroblasts (−hTERT; left graph) and BJ fibroblasts overexpressing hTERT (+hTERT; right graph) were either control treated (C) or treated with TGF‐β12 for indicated times. NOX4 mRNA levels relative to controls, which were set to 1, were measured by qRT–PCR. Error bars: ±SD. *p < 0.05, (n = 3). Immunoblots below graphs illustrate NOX4 and α‐SMA protein levels in extracts from normal BJ fibroblasts (left) and BJ fibroblasts overexpressing hTERT (right) treated with TGF‐β1 for indicated times. (b) Left: Percentage of TIF‐positive BJ fibroblasts that were either control treated (C) or treated with TGF‐β1 for 24 hr in the absence or presence of the Smad3 inhibitor SIS3. Center: quantitation of α‐SMA levels measured by immunoblotting extracts from BJ fibroblasts treated with TGF‐β1 for 24 hr in the absence or presence of the Smad3 inhibitor SIS3. Error bars: ±SD. *p < 0.05, (n = 3). Representative immunoblot (bottom, γ‐tubulin: loading control) and micrographs (right; α‐SMA: green, 53BP1 red; DAPI: blue) are shown. Scale bars: 500 µm. (c) Same as in B, with the exception that the NOX4 inhibitor VAS2870 (NOX4i) was used instead of SIS3. Error bars: ±SD. *p < 0.05, (n = 3). (d) Left graph: Percentage of TIF‐positive normal BJ fibroblasts that were either control treated (C) or treated with TGF‐β1 for 24 hr in the absence or presence of the ROS scavenger N‐acetyl cysteine (NAC). Error bars: ±SD. *p < 0.05, (n = 3). Center: quantitation of α‐SMA levels measured by immunoblotting extracts from BJ fibroblasts treated with TGF‐β1 for 24 hr in the absence or presence of the NAC. Error bars: ±SD. *p < 0.05, (n = 3). Representative immunoblot (bottom, γ‐tubulin: loading control) and micrographs (right; αSMA: green, 53BP1 red; DAPI: blue) are shown. Scale bars: 500 µm. (e) Left graph: Percentage of TIF‐positive normal BJ fibroblasts (−hTERT; left graph) and BJ fibroblasts overexpressing hTERT (+hTERT; right graph) that were either control treated (C), treated with increasing concentrations of H2O2 for 24 hr, or with zeocin for 4 hr as indicated. Right graph: quantitation of α‐SMA levels measured by immunoblotting extracts from BJ fibroblasts treated with TGF‐β1 for 24 hr in the absence or presence of H2O2 or zeocin, as indicated. Error bars: ±SD. *p < 0.05, (n = 3). Representative immunoblot (γ‐tubulin: loading control) and micrographs (right; α‐SMA: green, 53BP1 red; DAPI: blue) are shown. Scale bars: 500 µm