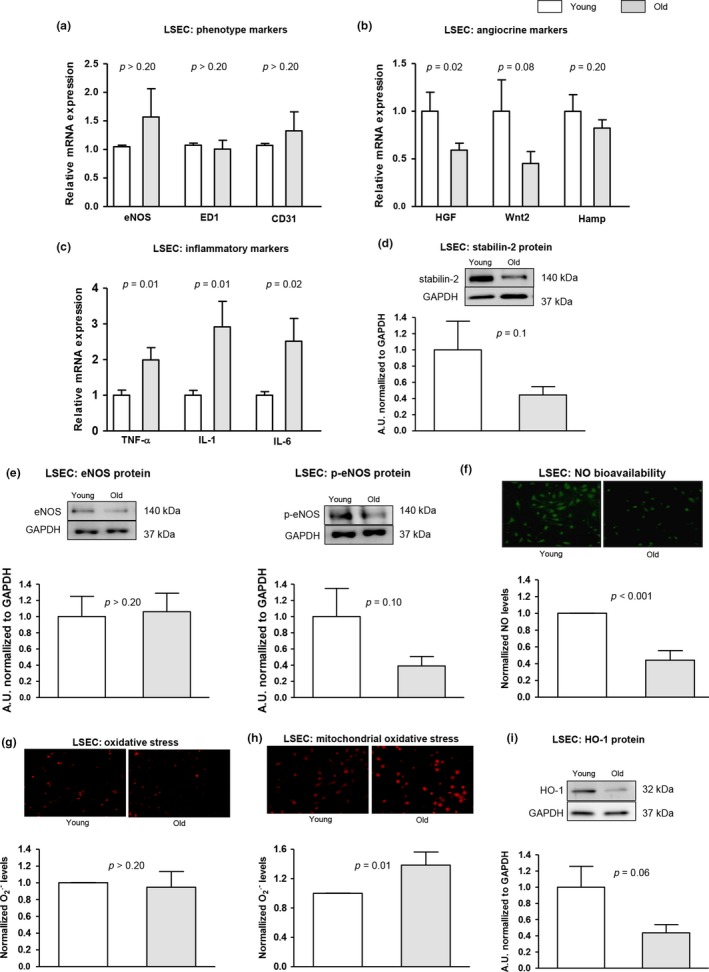
Figure 3.

LSEC phenotype in aged livers. The phenotype of LSEC freshly isolated from aged and young rats was characterized as follows. (a) mRNA expression of eNOS, ED1, and CD31. (b) mRNA expression of HGF, Wnt2, and Hamp. (c) mRNA expression of TNF‐α, IL‐1, and IL‐6. (d) Representative western blot of stabilin‐2 normalized to GAPDH. (e) Representative western blots of eNOS and p‐eNOS, normalized to GAPDH. (f) Representative images of nitric oxide bioavailability using DAF‐FM staining (green fluorescence) and corresponding quantification. (g) Levels of O2 . ‐ (red fluorescence) determined using DHE. (h) Representative images of mitochondrial O2 . ‐ measured using mitosox (red fluorescence) and corresponding quantification. (i) HO‐1 protein expression normalized to GAPDH. n = 6 per group. Results represent mean ± SEM
