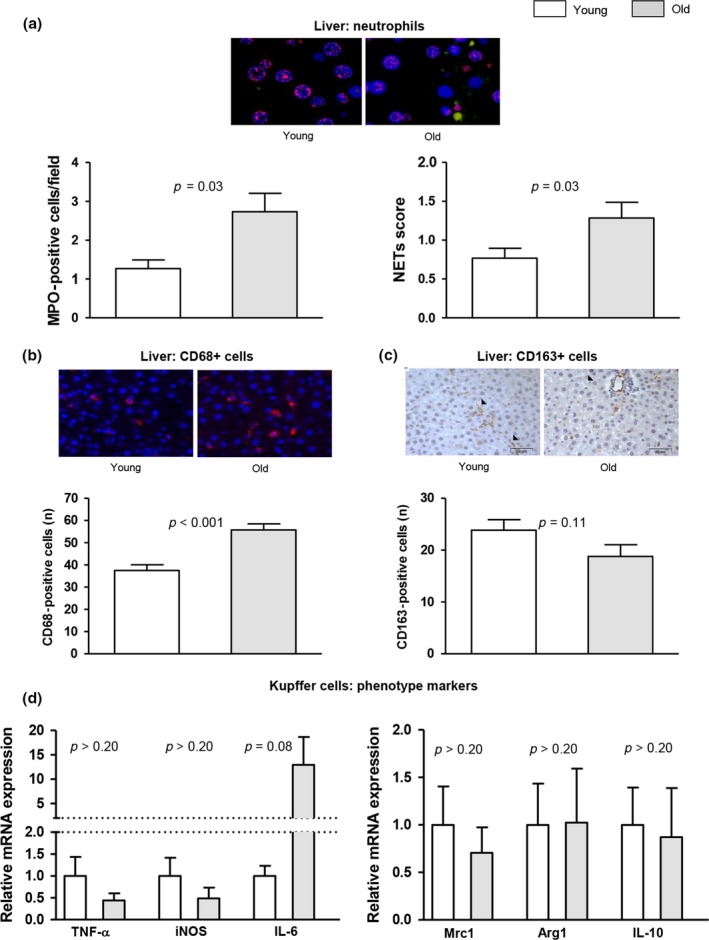
Figure 5.

Innate immune cell activation and inflammation in aging. (a) Representative images of neutrophil immunofluorescence in liver tissue (MPO in green, histone 2B in red, nuclei in blue). Left, neutrophil infiltration measured as MPO‐positive cells. Right, analysis of hepatic neutrophil extracellular traps (NETs) determined as colocalization of MPO and histone 2B. (b) Representative images of CD68 immunofluorescence in liver tissue and corresponding quantification. (c) Representative images of CD163 immunohistochemistry in liver tissue and its quantification. (d) Expression of TNF‐α, iNOS, IL‐6, Mrc1, Arg1, and IL‐10 in Kupffer cells freshly isolated from young and old rats. n = 12 (a‐c) and n = 6 (d) per group. Results represent mean ± SEM. All images 400×, scale bar = 50 μm
