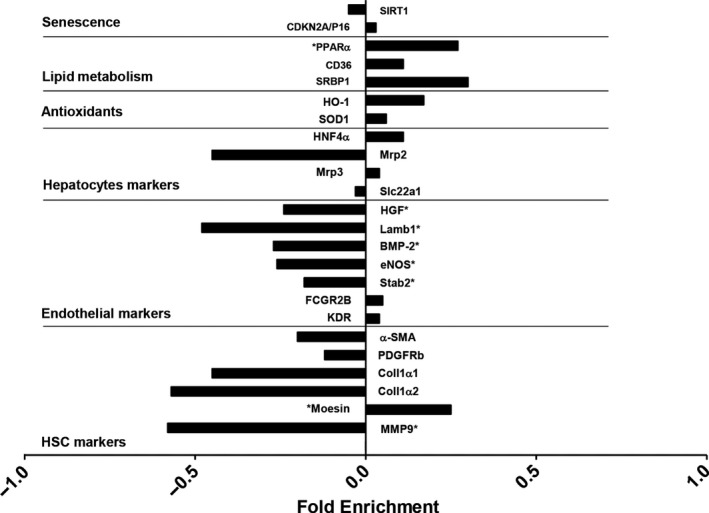
Figure 6.

Aged‐related changes in the human liver. Gene expression analysis in healthy young and old human livers. Data expressed as fold enrichment (log2) old relative to young (0.0). The fold enrichments are plotted using positive values for transcripts that are increased or using negative values for transcripts that are decreased in old humans. *p‐value <0.05, n = 14 young and 13 old livers. Clinical characteristics of donors are described in Supporting Information Table S2
