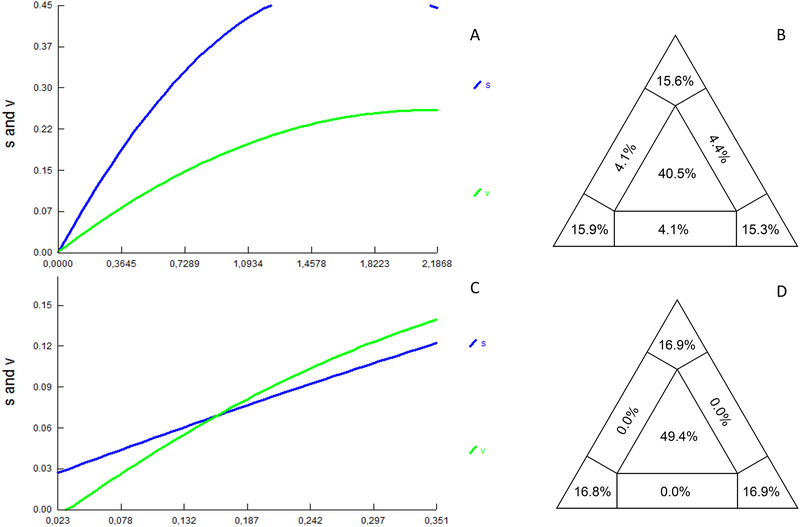
Figure 1. Transition and transversion versus divergence plots and likelihood mapping analysis for the POC-J13 phage data sets.
Pairwise transition and transversion versus divergence plots and likelihood mapping analyses are shown in the left and right panels, respectively. (A and B) Analysis of the 44 sequence alignment including the 36 phage sequences described in the paper (Table 1 and S1), the φPOC-J13 reference sequence (accession no. KJ603229), and seven additional divergent phage strains from GenBank. (C and D) Analysis of the alignment including only the 36 phage sequences described in the paper.

