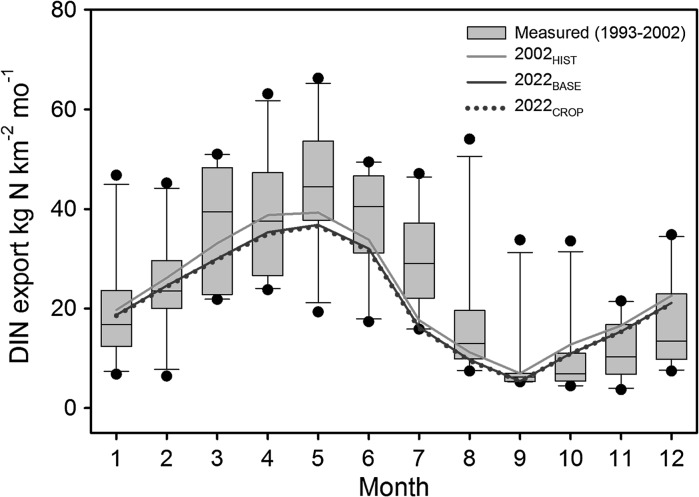
Fig. 4.
Upper panel comparison of measured (gray bars) and model-derived (lines) dissolved inorganic nitrogen (DIN) export (kg N km−2 mo−1) for the Mississippi River Basin. Box plot shows median value (horizontal lines), 25th and 75th percentile (box outline), 10th and 90th percentile (error bars), and 5th and 95th percentile (solid points)

