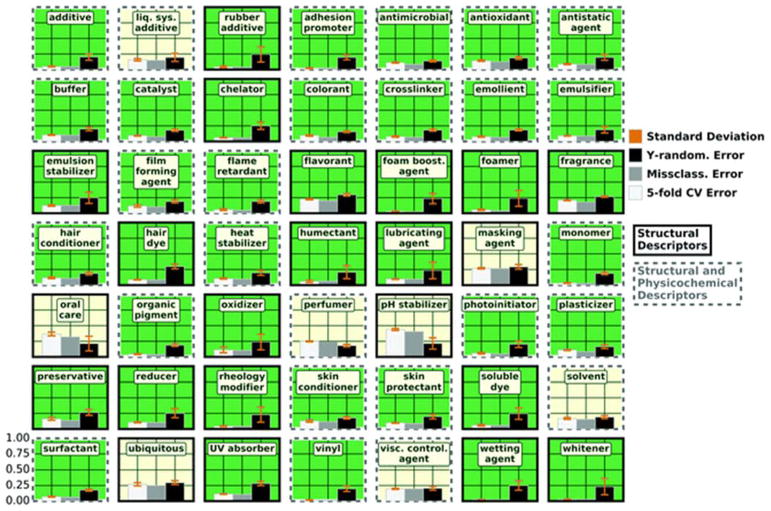
Fig. 3.
Mean 5-fold cross validation error (white), mean Y-randomization error (black), and model classification error (gray) for each of the 49 harmonized function models constructed. Standard deviations of the 5-fold CV and Y-randomization are shown in orange. Harmonized function QSURs constructed with structural descriptors have a black outline and QSURs constructed with both structural and physicochemical descriptors have a dashed gray outline. A green background indicates a valid model; a pale yellow background indicates an invalid model. The model with the highest balanced accuracy is shown.

