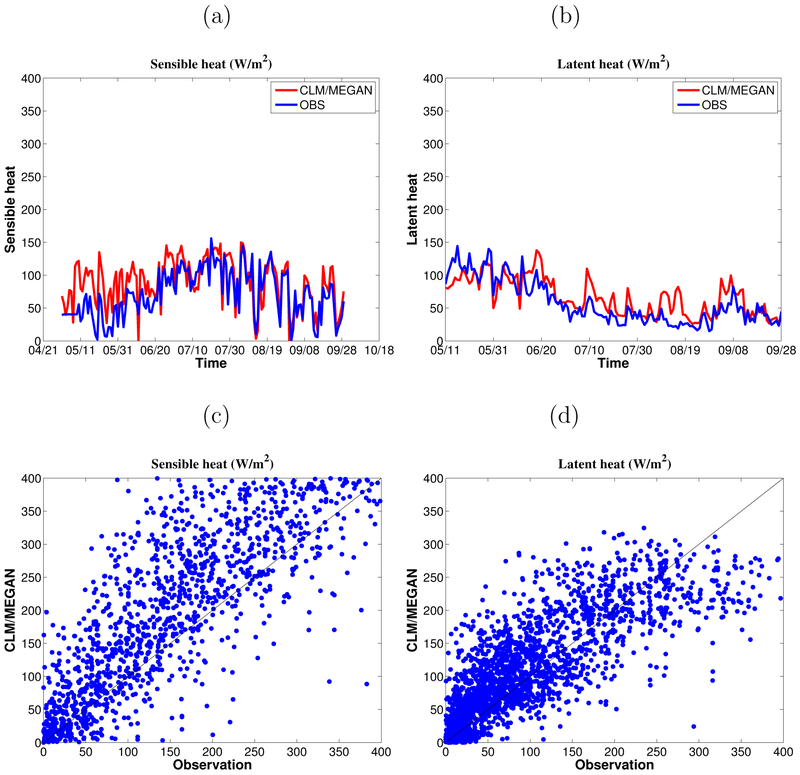
Figure 3:
Top panels show modeled and measured daily sensible heat (SH) (a) and latent heat (LH) (b) from May to September in 2012. Bottom panels show scatter plots of modeled and measured SH (c) and LH (d) from May to September in 2012. For the scatter plots, the calculated correlation coefficients, slopes, and intercepts with a linear fit are 0.86, 0.83, and 17.99 for SH and 0.92, 1.12, and 8.31 for LH respectively.

