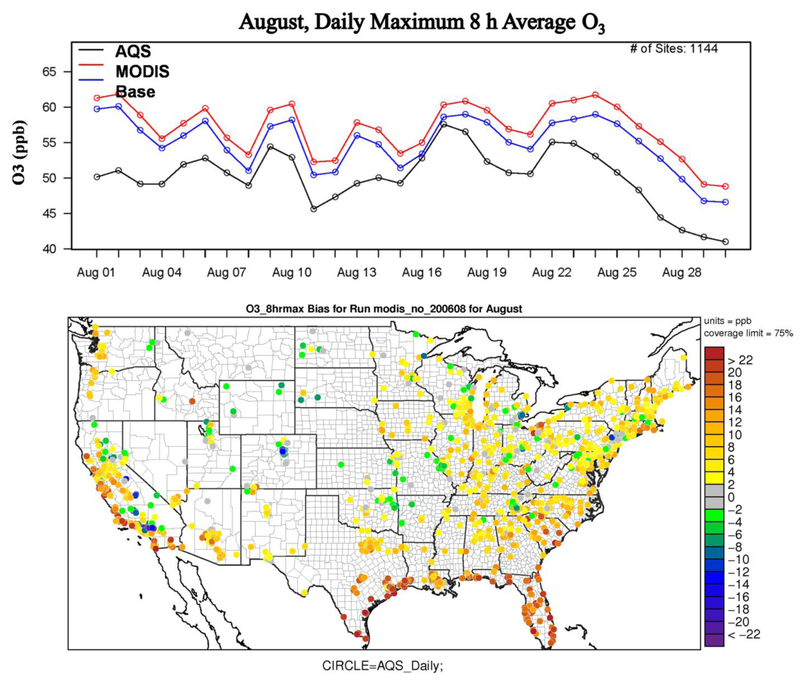
Figure 1.
Evaluation of August 2006 daily maximum 8-hour average O3 (ppb) simulated from an improved WRF/CMAQ with/without (base) MODIS vegetation and albedo input against the Environmental Protection Agency Air Quality System (AQS) sites. The top plot displays mean of daily maximum 8-hour average O3 from the base model (blue line), the model with MODIS input (red line), and all AQS sites (black line). The bottom plot displays the mean bias for daily maximum 8-hour average O3 simulated from WRF/CMAQ without MODIS input. The base model’s vegetation is computed from vegetation parameters prescribed in land use category lookup tables using equations 2 and 3 in Ran et al. [2015].

