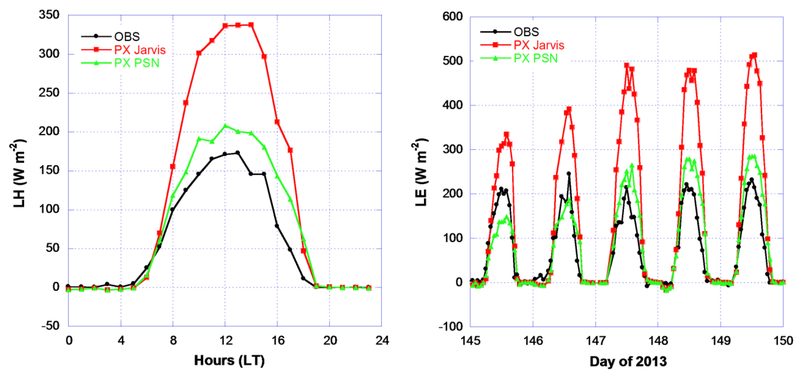
Figure 13.
Duke Forest Open Field/US-Dk1 site LH diurnal median (left plot) and selected hourly (right plot) comparisons. Simulations are conducted based on LAI = 3 (m2 m−2) and other parameters listed in table 4.1 for the periods of 17 May (day 137) to 18 June (day 169) and 18 to 28 September (day 261 to 271) 2013 with measurements. Hourly display is for 25 to 30 May 2013 (day 145 to 150).

