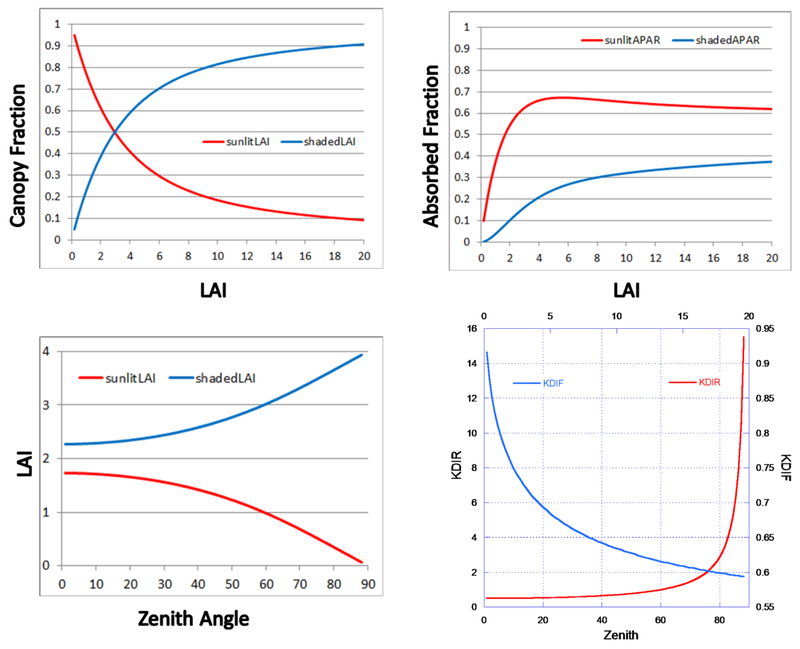
Figure 2.
Canopy scaling and radiative transfer parameter plots. The top row plots are the leaf canopy fraction (top left), and the ratio of absorbed PAR to incident PAR (top right) for the sunlit and shaded leaves. The bottom row plots show are the sunlit and shaded LAI (bottom left) with changing zenith angle, and the direct and diffuse extinction coefficients (bottom right) as a function of zenith angle and LAI. Parameters are computed based on US-Ha1 data on 13 June 2006 at 12pm with longitude = W 72.1715, latitude = N 42.5378, LAI = 4 (m2 m−2), zenith angle = 20°, x = 1 (spherical leaf), αleaf = 0.8 for PAR (leaf absorptivity), and αleaf = 0.2 for NIR, forest floor reflectance = 0.10.

