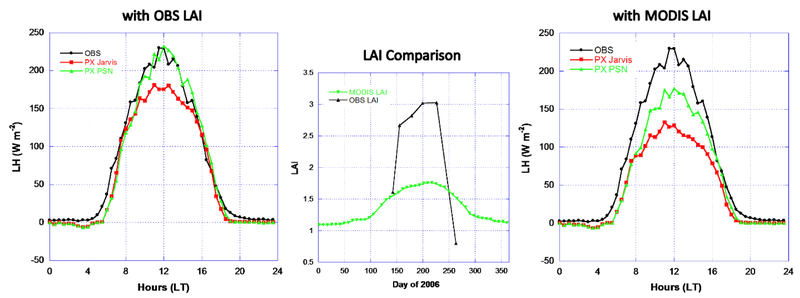
Figure 9.
Fermi Prairie/US-IB2 site LH diurnal median comparisons. LH is simulated with the photosynthesis-based and Jarvis approaches using the observed LAI (left plot) and the MODIS LAI (right plot) from 22 May (142) - 20 September (263) 2006. The observed LAI of the C4 grassland from the site 2006 biological data and processed 2006 MODIS LAI for the grassland land cover type at the 12 km CMAQ grid cell are displayed in the middle plot. Soil moisture measurements at 25 cm deep are used.

